Wyckoff Power Charting March 30, 2017 at 12:00 PM

We looked at the Technology Sector (XLK) in the last post (click here for a link). Another very important market sector is the Financials. Here is a high-altitude view of the Financial Sector from a Wyckoffian perspective... Read More
Wyckoff Power Charting March 25, 2017 at 12:00 PM

Leadership in the Technology Sector is generally a very good sign for the entire stock market. It bodes well for the market when technology stocks, as a group, are leadership as a rally starts... Read More
Wyckoff Power Charting March 18, 2017 at 09:00 AM

Crude oil is on a slippery slope downward. Was this completely unexpected or were there clues of the impending decline? The stock market is a discounting mechanism. Stocks traditionally light the way by starting to move prior to the underlying economic events... Read More
Wyckoff Power Charting March 11, 2017 at 10:00 AM

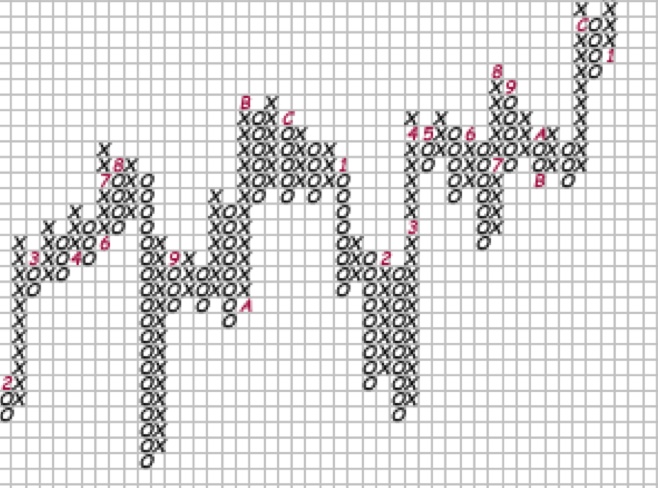
Point and Figure charts are generated from price volatility, unlike a vertical (bar) chart, which is plotted as a function of time. This is particularly valuable to Wyckoffians who are always on the search for a Cause being built... Read More
Wyckoff Power Charting March 04, 2017 at 10:30 AM
Sector activity can illuminate important thematic trends unfolding within the market. Point and Figure studies identify large Accumulation and Distribution Structures related to these themes poised to be campaigned over many months and years... Read More