What's New
CAMANO RELEASE | DECEMBER 2022
The season of holiday cheer is alive and well here at StockCharts with a huge collection of dynamic new tools and features that just rolled out around the site as part of our "Camano" product release. We've put together some highlights below to help you learn more about all that's included in our latest update.
MOBILE APP
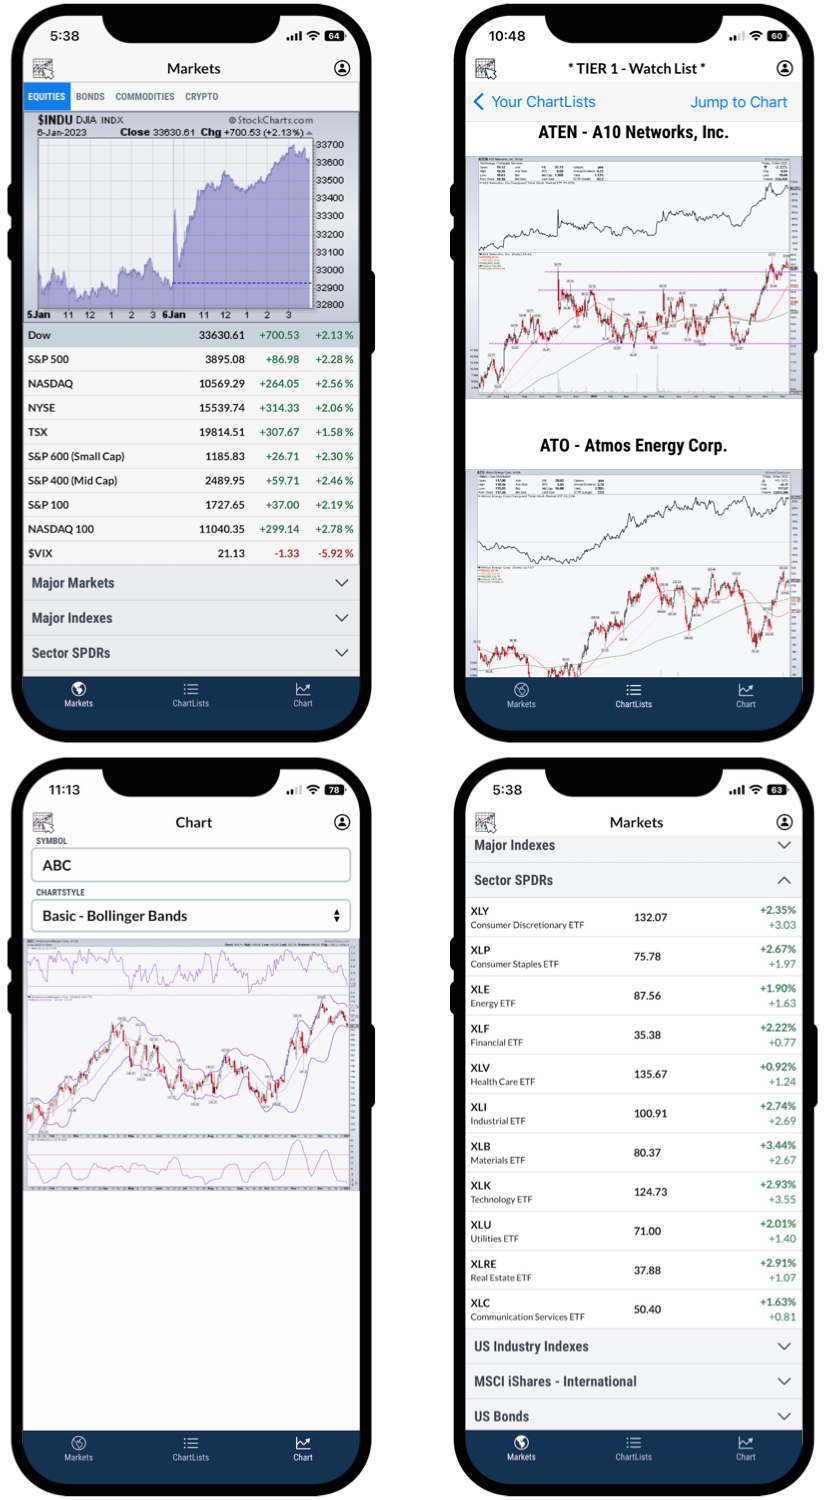
The New StockCharts Mobile App Lets You Chart On The Go And Follow Markets In Real Time
We're mobile! The official StockCharts iOS app is now live, bringing StockCharts members easy access to the markets and your charts anywhere, anytime.
See a detailed summary of the current markets, including stocks, bonds, commodities, major indexes, sectors, cryptocurrencies and much more. Access all of your ChartLists and quickly swipe through your saved charts within the app. Plus, view advanced real-time charts for any symbol with any of your saved ChartStyles to easily apply different indicators and settings.
TO INSTALL OUR MOBILE APP: Open the Apple App Store app on your iPhone or iPad and search for "StockCharts app" or use the QR Code below:

EARNINGS
Earnings Calendar With Reported Results And Upcoming Announcements
Our new Earnings Calendar brings you a powerful research tool for your stock analysis. The "Reported Earnings" tab shows you revenue and earnings results for companies that have recently reported, plus consensus estimates from the analysts. At a quick glance, you can see which companies have beat or missed on recent earnings.
The Earnings Calendar also includes an "Upcoming Earnings" tab with an extensive list of the companies set to report in the coming weeks. Stay ahead of these crucial events for the stocks you're following or quickly pull up a chart to see how they're trading before the next report.
OPTIONS
Two New Ways To See Detailed Options Prices With Calls, Puts, And The Complete Chain Table
With our new Options Summary page, you can view detailed options quotes for calls and puts on any security we cover. See call and put contracts separately with the "List View", or flip over to the "Straddle View" to pinpoint the perfect options strategy with the complete chain table.
In addition to the standalone Options Summary page, we've introduced a new "Options View" for your SharpCharts ChartLists. StockCharts members can track the same detailed options quotes for all symbols within a ChartList, clicking through with ease instead of manually typing in one ticker at a time.
SCANNING
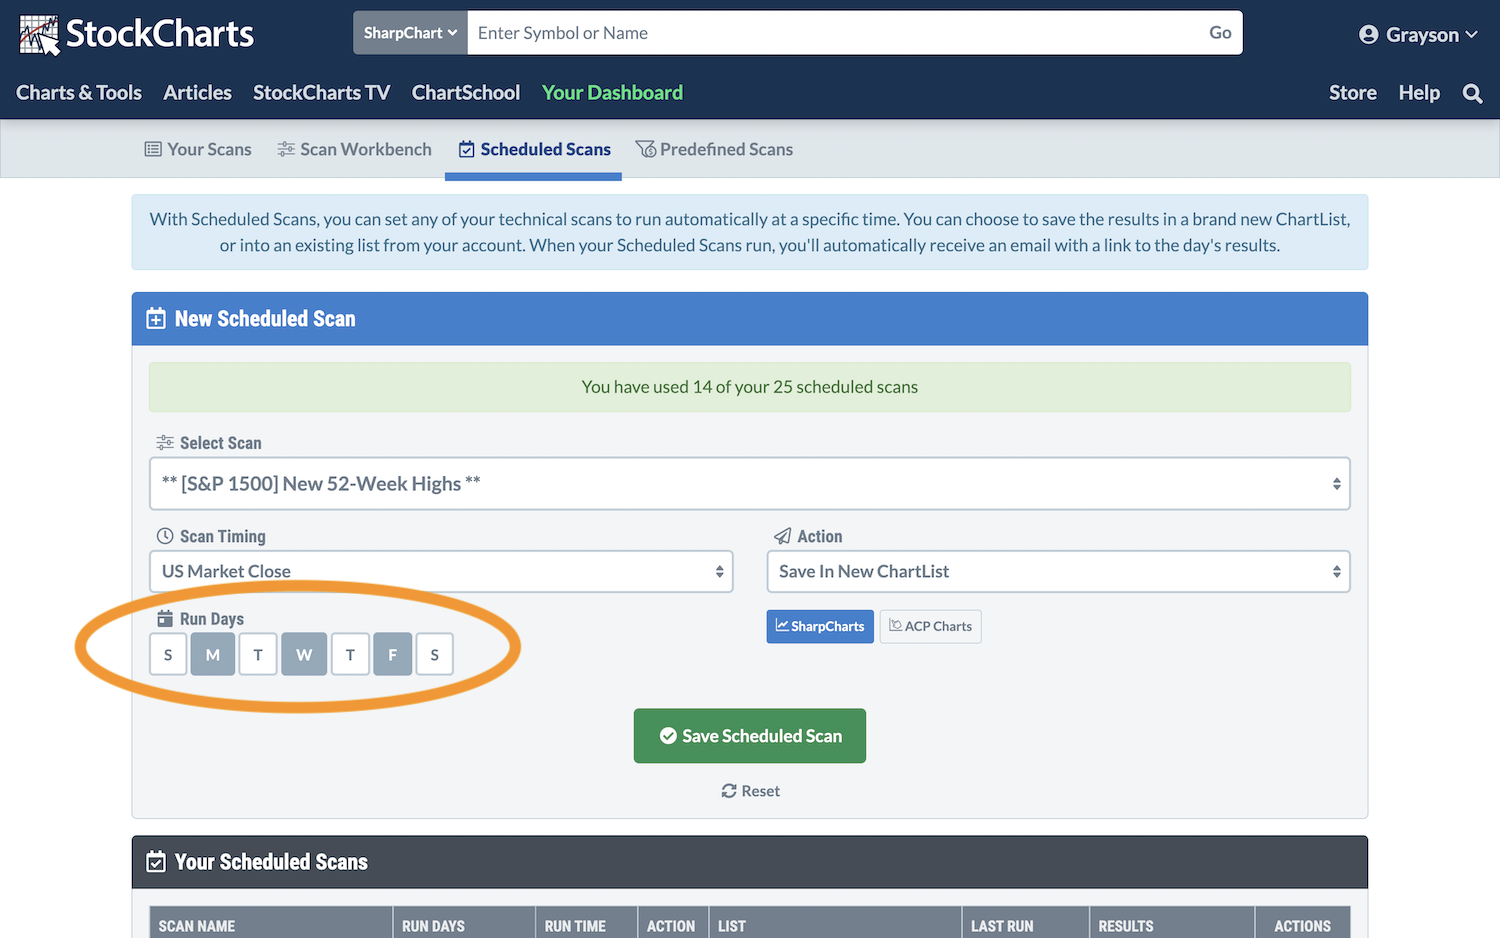
Set Specific Days And Times For Your Scheduled Scans To Further Automate Your Research
Our Scheduled Scans feature lets you set any of your custom technical scans to run automatically at a specific time of your choosing, whether it's a particular market open, right after the close, or even a totally custom time of day. The latest enhancement to this popular feature gives you the ability to select specific days for your Scheduled Scans in addition to the time of day options that already exist.
Any day and any time are now fair game, whether you want to run a particular scan every morning, Friday afternoon at the end of a trading week or Sunday evening before the next week kicks off. In all, it means you now have even more control when automating your scanning workflow.
SHARPCHARTS
The Sample Chart Gallery Gives You Access To Expertly-Crafted Chart Templates In One Click
With our new Sample Chart Gallery, you can browse an extensive collection of pre-created charts, ready to use right out of the gate or perfect as a starting place for you to customize and make your own. Organized by category, you can quickly find charts to serve every technical approach. Whether you're looking for specific strategies like Relative Strength or Momentum, timeframe charts for short, mid and long-term analysis, or specialized charts from our expert contributors, you'll find it in our Sample Chart Gallery.
SCANNING
A New Sample Scan Library Lets You Browse And Run Dozens Of Pre-Built Market Screens
Scanning is now easier than ever before with a huge collection of technical scans pre-built for you, ready to run in a single click. The new Sample Scan Library includes a comprehensive list of popular bullish and bearish scans for particular technical moves and indicators, candlestick patterns, Point & Figure patterns and even a set of favorite scans designed by our expert contributors. Run any of the sample scans in a single click, or click the Edit button to see the scan syntax and start customizing it with other technical criteria of your own.
ACP
The “Detachable” Annotations Panel Allows More Room For Your Drawings
You can now annotate your ACP charts at full width by "detaching" the annotations panel. The annotations window will break away from the left side of the screen and turn into a draggable widget that you can position anywhere around the platform. That means more room for your ACP charts in drawing mode. You can even leave the annotations window open indefinitely and simply drag it up from the bottom of the screen when you're ready to draw.
ACP
Maximized Indicator Panels To Help Focus Your Chart Analysis
It's tempting to load up your charts with multiple indicators, but doing so can make it challenging to really focus on just one tool at a time. So to help, you can now temporarily "maximize" the indicators on your ACP charts to make them a single point of focus.
In ACP, simply hover over the indicator legend and look for the full-screen icon. Give it a click, and that indicator will expand to occupy as much space on the chart as possible. When you've seen enough, simply hover over the legend and click the minimize icon to get back to your original chart layout.
And Those Are Just The Biggest Ones...
Other new features and improvements you'll see around StockCharts include:
-
✅ Advanced Alert Editor
As you write your custom technical alerts, our new Advanced Alert Editor provides helpful tips, warnings, error messages and other guidance while you work. This addition to our alert workbench is designed to help take your market monitoring to the next level.
-
✅ Dividend data now available in Summary view for SharpCharts ChartLists
New column options in Summary view let you see dividend dates, values and yield alongside all of the other common price data, fundamental figures and technical stats you want to follow.
-
✅ Streamlined ChartList setup from Your Dashboard and all ChartList Views
Setting up a new ChartList is easier and faster than ever before with the ability to add symbols to the list when you first create it. Type in all of the symbols you want to include or simply copy and paste a list right into the box.
-
✅ Quick settings menu for on-the-fly changes to your ACP charts
Look for the new gear icon in the lower right corner of your ACP charts to access a "quick settings" menu with controls for chart scaling, dividend adjustment, y-axis scale, pre- and post-market data, and more.
-
✅ Right-click menu with helpful chart actions in ACP
Right click anywhere on your ACP charts to launch a helpful menu with common actions like saving, sharing, downloading, adding price alerts and editing chart settings.
-
✅ Indicator action buttons for streamlined chart customizations
Hover over the chart legends on an ACP chart to see quick action buttons that let you hide or show the indicator, access its settings or delete that indicator right from the chart.
-
✅ “Apply To All” option for Period when using multi-chart layouts in ACP
When using a multi-chart layout, you can now change the period for all charts together in a single click with the new "Apply To All" option.
-
✅ Earnings dates in full quote for ACP
See recent earnings dates and stay ahead of upcoming reports with earnings dates and timing information built directly into the Full Quote header at the top of your ACP charts.
-
✅ Redesigned “drawer” in ACP with improved ChartList navigation and easy access to other tools
A refreshed layout for the all-important "drawer" in ACP delivers easy-to-use tabs for different drawer views and better, easier-to-use navigation for your ChartLists.
-
✅ Custom top and bottom margin settings for more precise chart scale control in ACP
You can now control the space above and below the price bars on your ACP charts with new top and bottom margin settings. Plus, click and drag directly on the Y-axis to manipulate those margins on the fly.
-
✅ Run scans and create alerts for the indicators in Dave Landry's Trading Simplified plug-in
The free "Trading Simplified" ACP plug-in brings you the exact stick-with-the-trend indicators that Dave Landry uses to stay on the right side of the markets, and you can now incorporate those same indicators directly into your own custom scans and technical alerts.
-
✅ User-Defined Indexes Now Supported In ACP
You can now create your own personal indexes and use ACP to chart and analyze them just like any other symbol.
-
🐛 Bug fixes and stability enhancements
...and plenty of other behind-the-scenes improvements around the site.