| Hey There Fellow ChartWatchers |
Work smarter, not harder.
Especially when it comes to trading and investing, that's a core tenet that I try my best to follow. Markets are tricky enough. Why further complicate 'em if you don't have to?
So on this week's episode of "StockCharts In Focus", we're demonstrating how a few simple setups in your StockCharts account can help you work smarter in your search for new stocks to buy, automating the discovery process by saving the strongest names in the S&P 1500 straight to your account after every trading day.
By creating a few ChartLists and then scheduling some scans for new highs over 5 different timeframes, you can create an automated stock watchlist system right in your StockCharts account. I'll walk you through the process from start to finish and show you exactly how to replicate the very same process that I use daily in my own trading approach.
Click the thumbnail below to watch now!
 |
| Chart on, my friends. |
| Grayson Roze |
VP of Operations, StockCharts.com
Author, Trading For Dummies
Author, Tensile Trading |
  |
|
|
| THIS WEEK'S ARTICLES |
|
|
|
|
| The Mindful Investor |
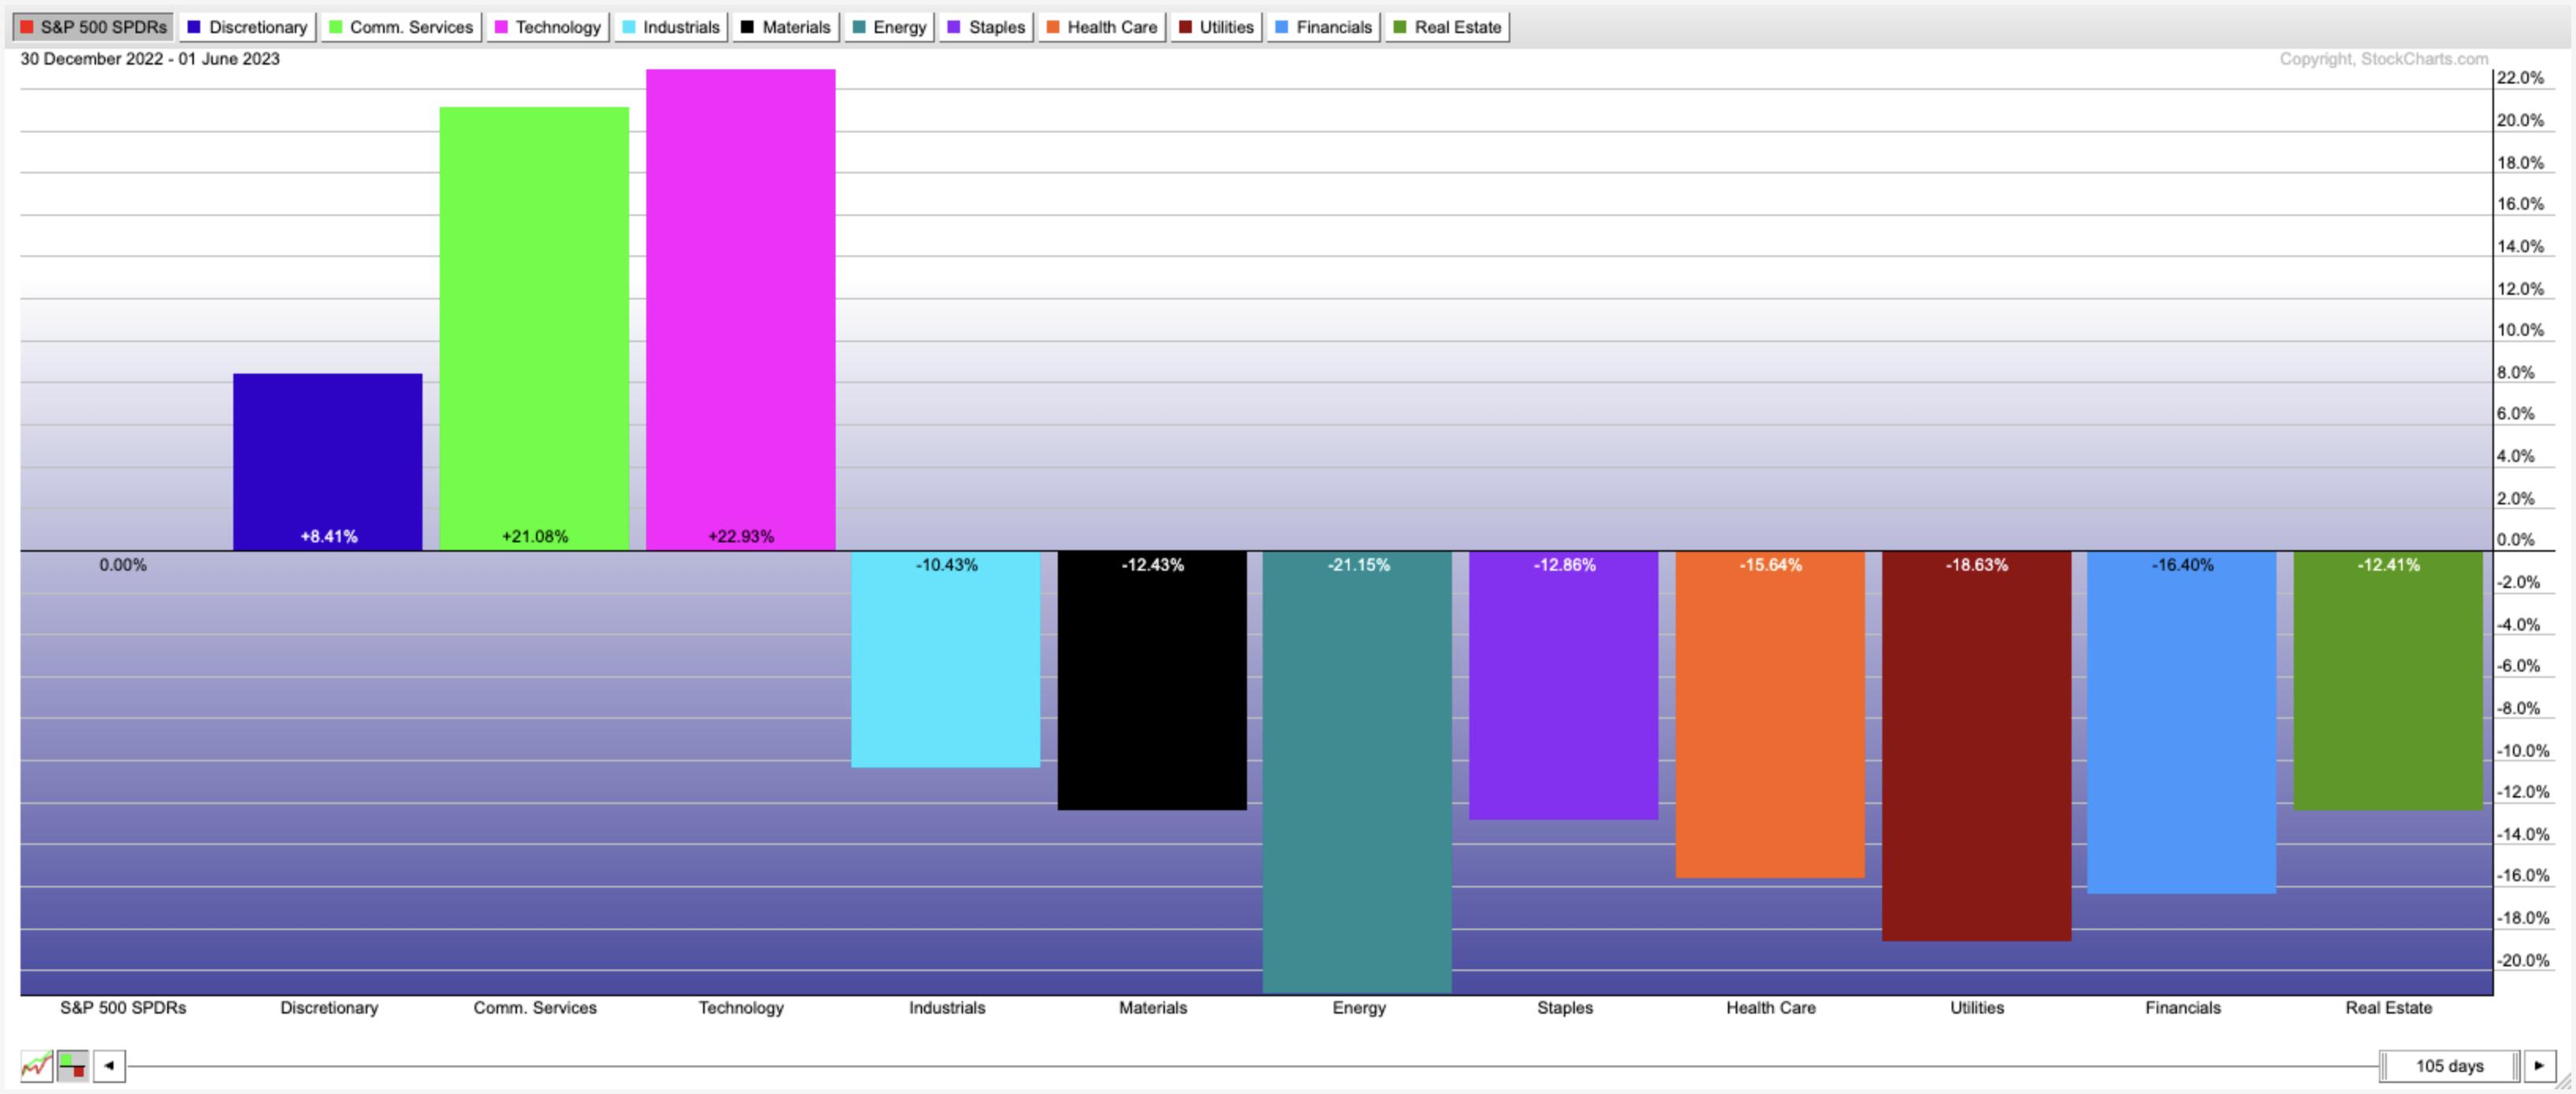
| The Bull Case for Energy is Clear |
| by David Keller |
| What compels me to write a bold headline claiming one sector is obviously poised to break out to the upside? As a trend follower, I have three goals every day: identify trends, follow those trends, and anticipate when those trends may reverse... |
|
|
|
|
|
|
|
| Art's Charts |
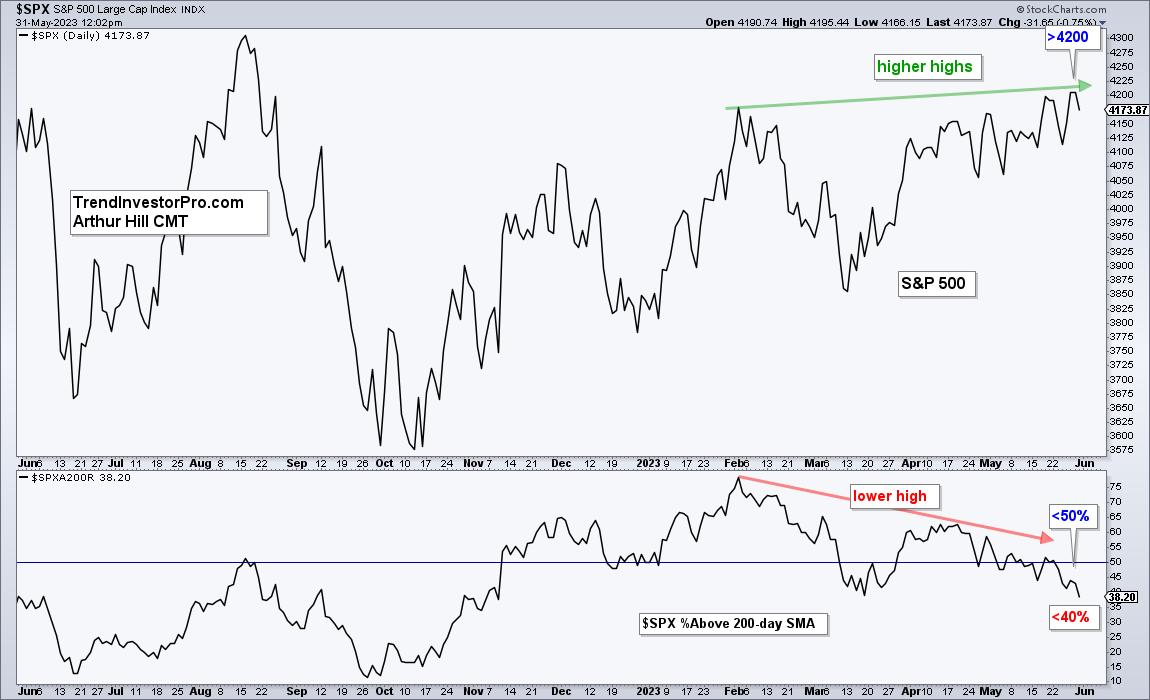
| Pesky Breadth Divergence Persists |
| by Arthur Hill |
| The S&P 500 recently moved above its February high to extend its uptrend, but all is not well under the surface. Fewer stocks are participating in the May advance and a key breadth indicator formed a bearish divergence... |
|
|
|
|
|
|
|
| DecisionPoint |
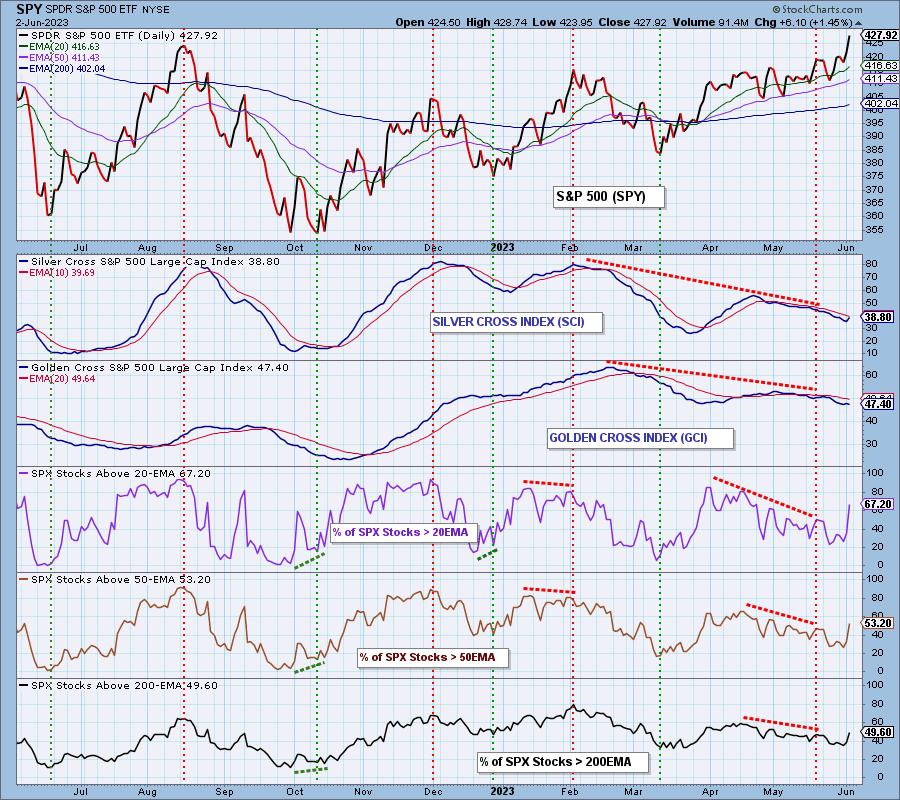
| Broad Market Rally a Turning Point |
| by Erin Swenlin, Carl Swenlin |
| Today, we saw broadening of participation by comparing the percentage change of the cap-weighted version of the S&P 500, SPY (+1.50%), versus the equal-weighted, RSP (+2.25%), which shows that today's RSP advanced 52% more than SPY... |
|
|
|
|
|
|
|
| RRG Charts |
| How To Benefit From a Big Rotation in Asian Markets |
| by Julius de Kempenaer |
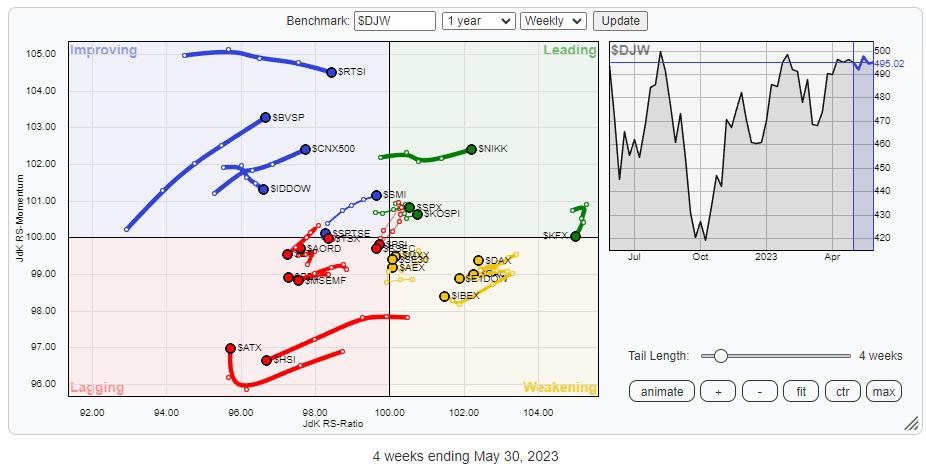
| It's been a while since we discussed international stock markets. Above is the Relative Rotation Graph that shows the rotation for a group of international stock market indices against $DJW, The Dow Jones Global Index... |
|
|
|
|
|
|
|
| MORE ARTICLES → |
|
|
|
| Breadth is Back | Guest Host Jay Woods, CMT | The Final (06.02.23) |
|
|
|
|
|
| ChartChat with Chip Anderson and Julius de Kempenaer, Part Two | StockCharts TV |
|
|
|
|
|
| Stock Market Roadmap for 2024? | Bruce Fraser | Power Charting (06.02.23) |
|
|
|
|
|
| Best Practices for Basing Patterns | David Keller, CMT | The Final Bar (06.01.23) |
|
|
|
|
|
| Why Gold & Silver Are DUDS | Tom Bowley | Trading Places (06.01.23) |
|
|
|
|
|
| The AUTOMATED Way To Find Strong Stocks Making New Highs | Grayson Roze | StockCharts In Focus |
|
|
|
|
|
| UPCOMING GUESTS |
|
|
|
|
|
|
| June 13th |
| Gina Martin Adams, CMT, CFA |
| Chief Equity Strategist, Bloomberg Intelligence |
| Appearing On: The Final Bar (4:00pm ET) |
|
|
|
| WATCH LIVE → |
|


