SETUP GUIDE

STEP 1 OF 3

First, let's set up your default chart


One of the most important customizations you can make as a StockCharts Member is your default "ChartStyle" – the chart type, period, overlays, indicators and other settings you'll see whenever you pull up a new ticker symbol.

To help you get started, you can select one of the popular pre-built ChartStyles below.

(Don't worry, you can always change the settings of your default ChartStyle in the future)

The John Murphy
sample chart

click to preview full chart

A timeless, no-nonsense chart layout created by John Murphy, with OHLC bars on a 1-year daily chart. Includes Volume, 50 and 200-day Moving Averages and price relative to the S&P 500.

StockCharts Classic
sample chart

click to preview full chart

Our classic, award-winning layout, with daily candlesticks on a 1-year chart. Simple yet powerful, this style includes 50 and 200-day Moving Averages, Volume, RSI and MACD.

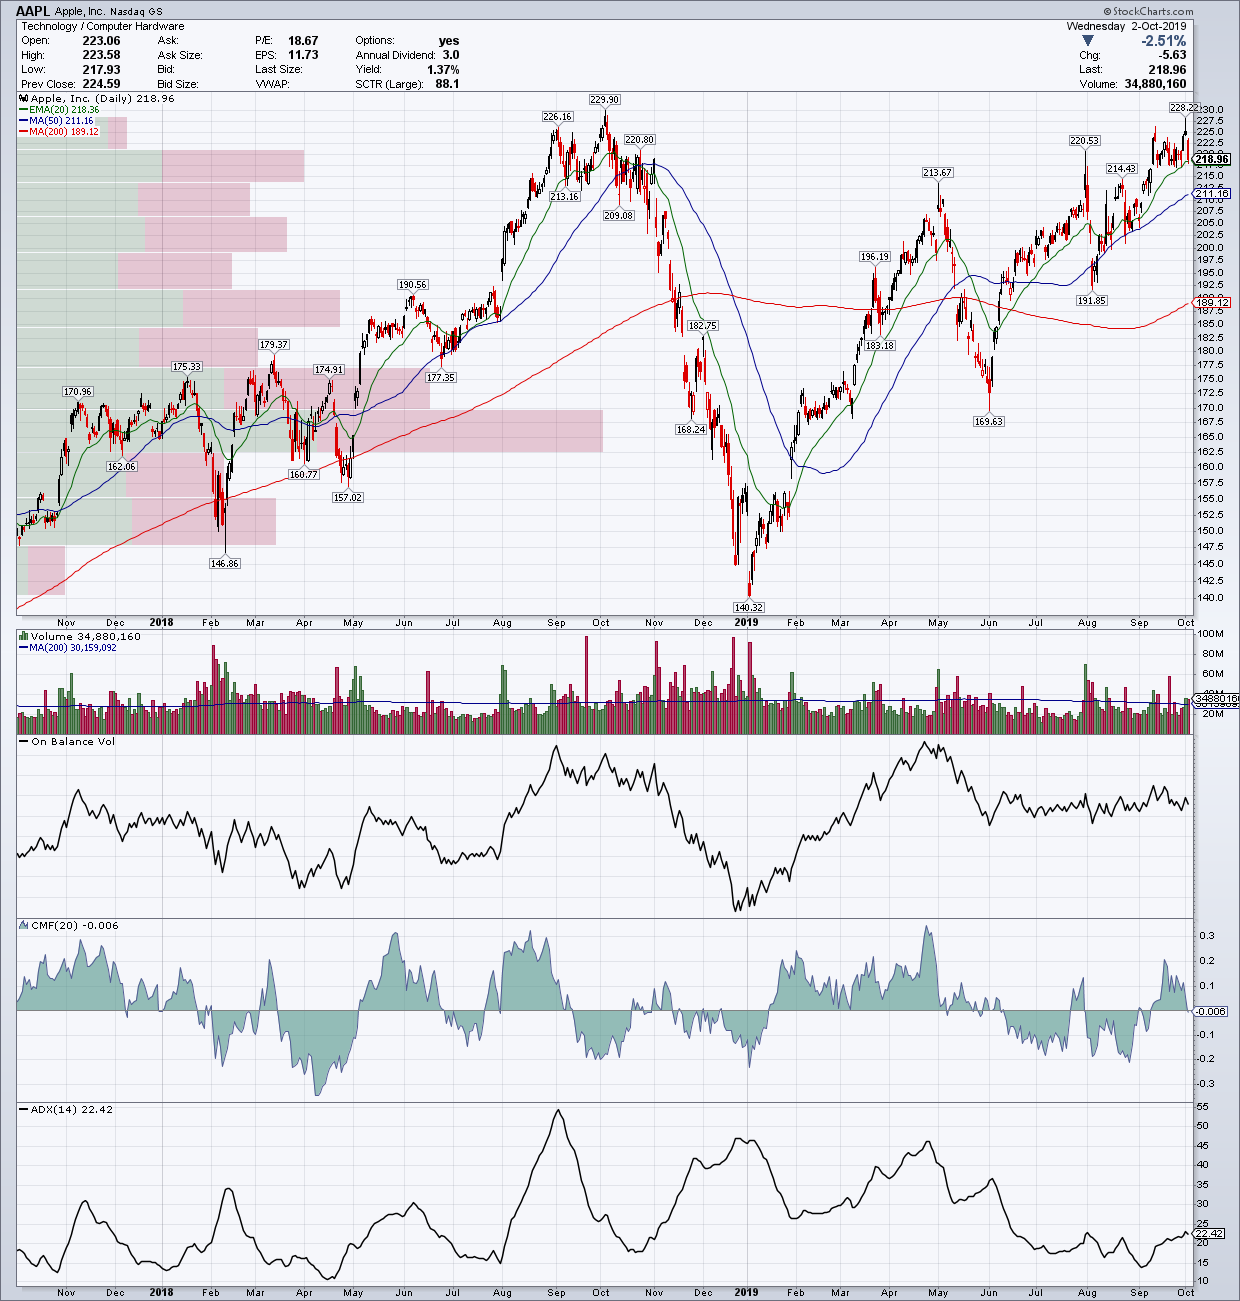
Trend and Volume
sample chart

click to preview full chart

A 2-year daily candlestick chart designed for trend and volume analysis. Includes Volume By Price, Volume, OBV and Chaikin Money Flow, plus 20, 50 and 200-day Moving Averages, ADX and the unique Chande Trend Meter.

Relative Strength
sample chart

click to preview full chart

Daily candlesticks on a 1-year chart with price relative to the S&P Large, Mid and Small Caps, plus 50 and 200-day Moving Averages, Volume, SCTRs and RSI.

Weekly Elder Bars
sample chart

click to preview full chart

For longer-term analysis, this 5-year weekly chart features Elder Impulse bars. Includes price relative to the S&P 500, our Dividends indicator, RSI, MACD, SCTRs, 50 and 150-week Moving Averages and Volume.

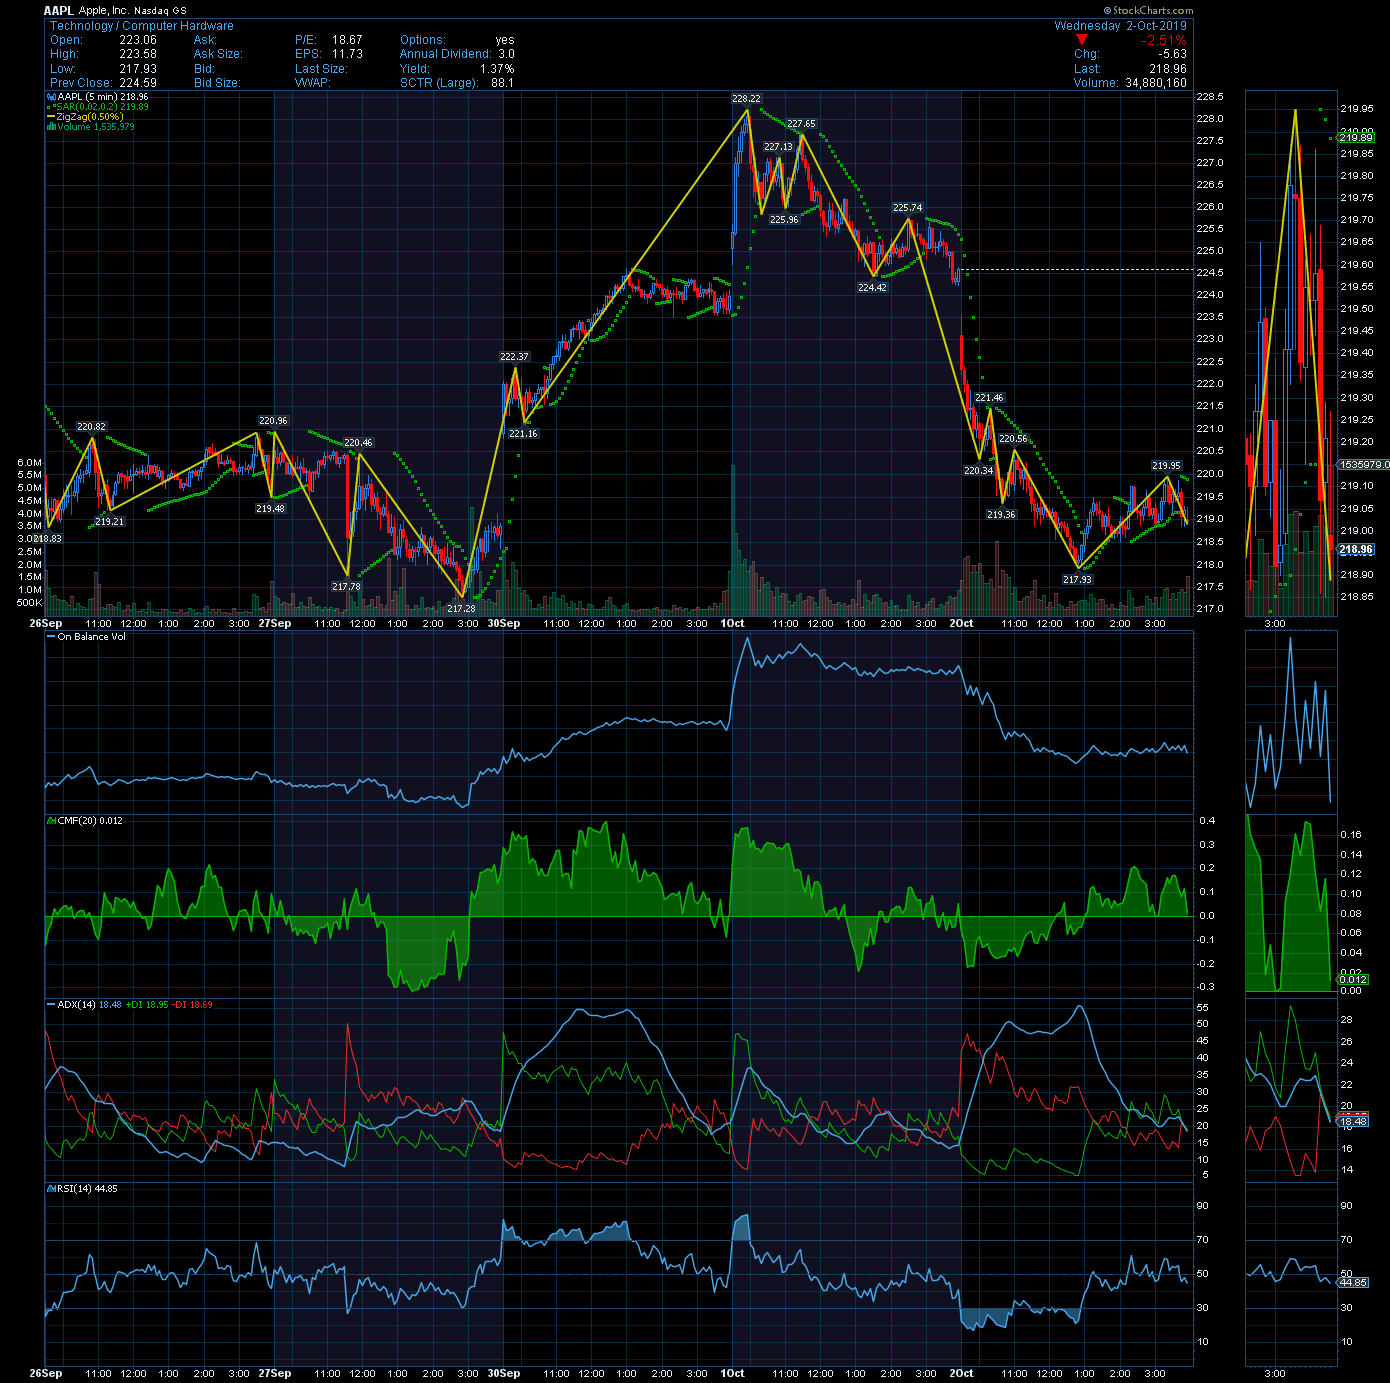
Short-Term Trading
sample chart

click to preview full chart

See the intraday action with 5-minute candlesticks for the past 5 trading days. Includes Parabolic SAR, the ZigZag indicator, Volume, On Balance Volume, Chaikin Money Flow, ADX and RSI.