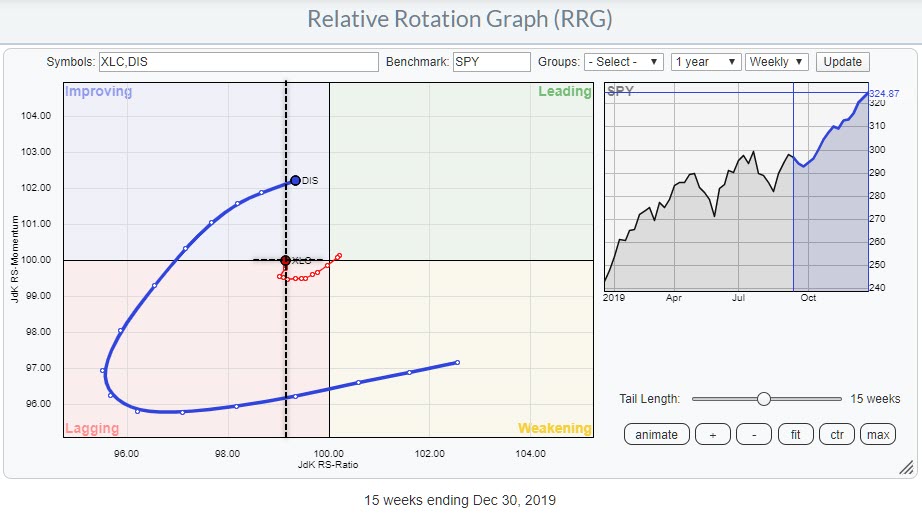
 Weekly RRG for XLC and DIS vs SPY
XLC, the Communication Services Sector, is sending some mixed signals.
On the price chart, XLC convincingly cleared resistance at $51 in November, when it pushed above the horizontal boundary that ran over the highs (four in total) of 2018 and 2019.
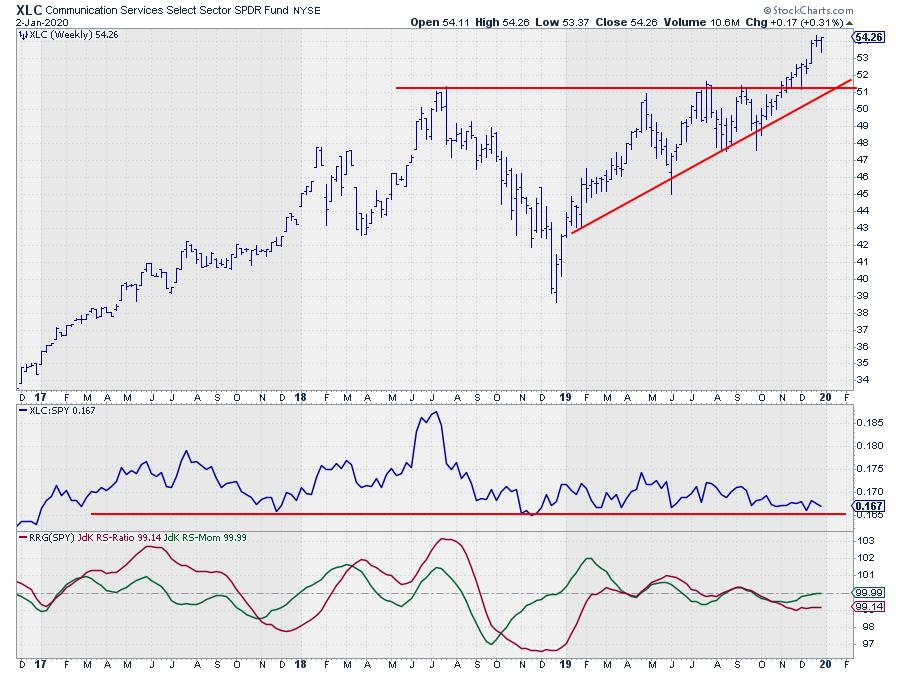 Weekly price chart of XLC with relative strength vs. SPY
That level was tested one more time as support a few weeks later. The rally that started after the break continues to this day. No doubt that this is a bullish structure for the sector.
Relative Strength Not Bullish... Yet!
The relative picture, on the other hand is less bullish, or maybe "not yet bullish." The raw RS-Line is hovering above a horizontal support level that has been in play since 2017. A downward break of that level will very likely have negative implications for the relative outlook/strength for XLC against the S&P 500.
The resulting RRG, on a weekly basis, puts XLC at the left hand side of the plot and on the verge of crossing over from lagging into improving, not too far from the center (SPY) of the chart. This means that the RRG-Lines, JdK RS-Momentum especially, are picking up some underlying improvement for XLC vs. SPY.
XLC starting to offer good possibilities?
When we assume the scenario that the horizontal support in relative strength for XLC will hold, as well as that the rotation for XLC on the RRG will continue into the improving quadrant and onwards to leading, this sector may be offering some good possibilities.
As we're not there yet, I want to look into the sector components to see if there are any possible future leaders for this sector to be found. To do that, I'll open the RRG for the predefined group of XLC members and walk through all members to study their tails on the RRG.
One that stands out on that chart is Walt Disney (DIS). On the RRG at the top of this article I have added both XLC and DIS, with SPY as the benchmark. Setting up an RRG like this helps you to visualize the rotation of a sector (and an individual stock) against SPY, but also the individual stock(s) against the sector benchmark.
The dotted black lines indicate the cartesian plane that visualizes the position and rotation for DIS against XLC. On the weekly timeframe, this suggests that DIS is or will be one of the leading stocks in the Communication Services sector going forward.
Daily Charts Starting to Back Up Positive Scenario
As a double check, we can run the same RRG on the daily timeframe. That shows the picture printed below.
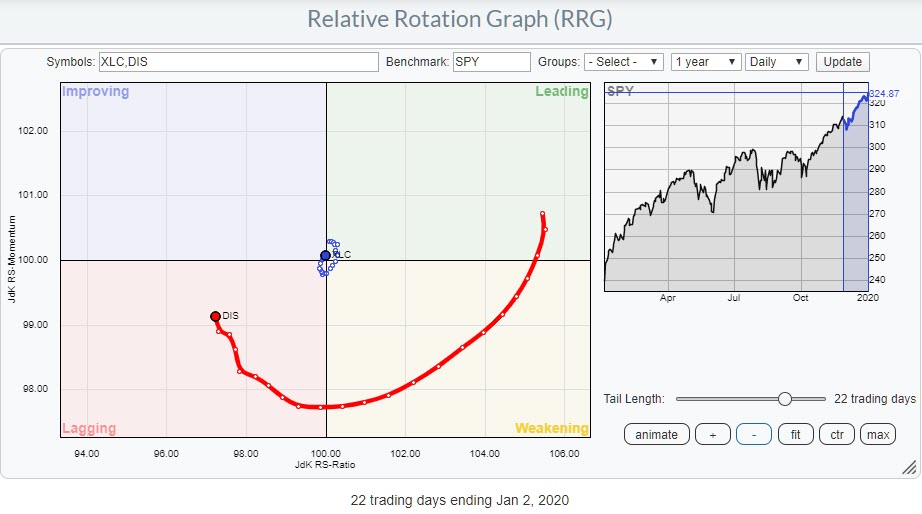
On this time frame XLC is rotating very, VERY, close to the SPY benchmark, which means that the sector performance is in line with the benchmark. The good thing is that, at the moment the tail of XLC vs. SPY is at a positive RRG-Heading and pushing towards and into the leading quadrant.
The very long tail of DIS rotated wide around both benchmarks inside the lagging quadrant, but is already rapidly picking up relative momentum. A further improvement of relative momentum on the daily scale will help DIS to push further into the leading quadrant on the weekly chart.
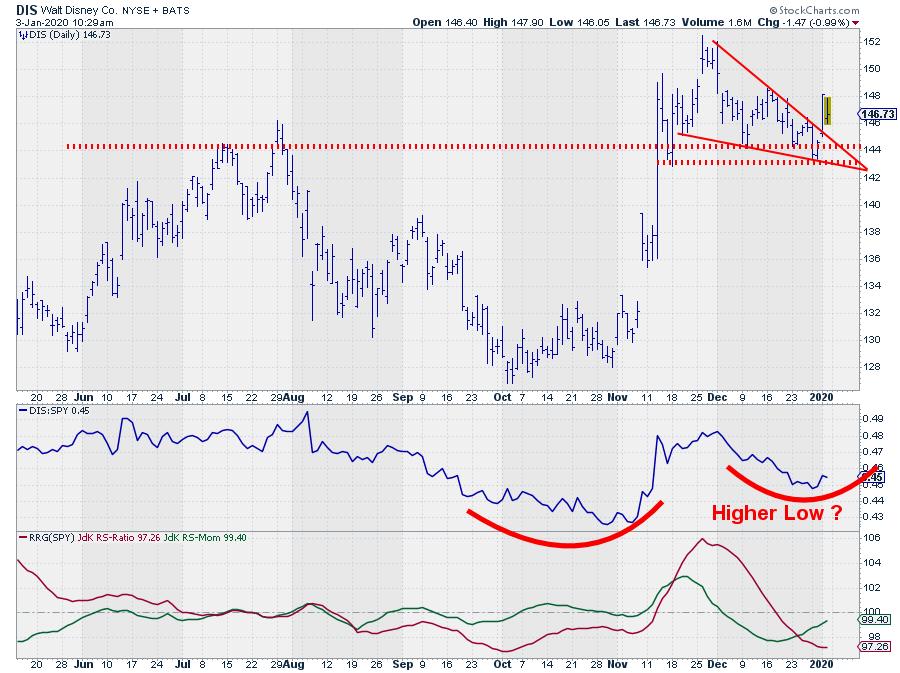
The upward break out of the falling wedge pattern on the daily chart will certainly help further improvement for DIS.
--Julius
#MV2020 is only one day away (or today, depending on when you read this). The event, hosted by earningsbeats.com, has a solid line up of speakers. John Murphy will kick off the day as the key-note speaker, followed by Arthur Hill, yours truly, David Keller, Greg Schnell, Mary Ellen McGonagle, Erin Swenlin, Bruce Fraser and Tom Bowley.
You can still register here.
My regular blog is the RRG Chartsblog. If you would like to receive a notification when a new article is published there, simply "Subscribe" with your email address.
Julius de Kempenaer
Senior Technical Analyst, StockCharts.com
Creator, Relative Rotation Graphs
Founder, RRG Research
Want to stay up to date with the latest market insights from Julius?
– Follow @RRGResearch on Twitter
– Like RRG Research on Facebook
– Follow RRG Research on LinkedIn
– Subscribe to the RRG Charts blog on StockCharts
Feedback, comments or questions are welcome at Juliusdk@stockcharts.com. I cannot promise to respond to each and every message, but I will certainly read them and, where reasonably possible, use the feedback and comments or answer questions.
To discuss RRG with me on S.C.A.N., tag me using the handle Julius_RRG.
RRG, Relative Rotation Graphs, JdK RS-Ratio, and JdK RS-Momentum are registered trademarks of RRG Research.
Julius de Kempenaer
Senior Technical Analyst, StockCharts.com
Creator, Relative Rotation Graphs
Founder, RRG Research
Host of: Sector Spotlight
Please find my handles for social media channels under the Bio below.
Feedback, comments or questions are welcome at Juliusdk@stockcharts.com. I cannot promise to respond to each and every message, but I will certainly read them and, where reasonably possible, use the feedback and comments or answer questions.
To discuss RRG with me on S.C.A.N., tag me using the handle Julius_RRG.
RRG, Relative Rotation Graphs, JdK RS-Ratio, and JdK RS-Momentum are registered trademarks of RRG Research.
