Another insightful issue of the ChartWachers Newsletter has arrived!

Expert Technical Commentary Delivered Straight To Your Inbox

June 16, 2018

Hello Fellow ChartWatchers!

Wow, what a whirlwind week. We had Fed announcements, we had tariff talks, we had monumental international meetings, major merger decisions and huge bidding wars - and that’s before we even get to what’s been happening here at StockCharts! In addition to this week’s articles, I’ve got some important announcements for you about a few things going on here at HQ.

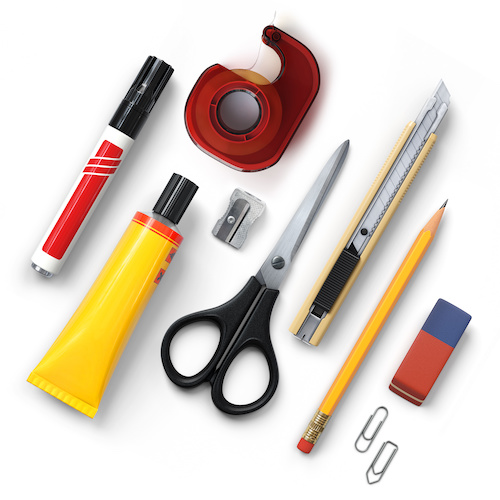
The Gear Is Here! The Gear Is Here!

Have you seen our new-and-improved StockCharts Store? If not, drop what you're doing and click here to check it out. With a completely updated design and dozens of new books, DVDs and other helpful products, it's safe to say the store is better than ever before. My personal favorite addition, however, is our new StockCharts gear.

Now, we do have more awesome merchandise on its way, including polo shirts, golf accessories, mugs and plenty of other great items, but I couldn’t contain my excitement any longer. Between our new hats, lovely rollerball pens, coaster sets and water bottles, I just had to start spreading the word. Keep an eye out for another announcement when the rest of our StockCharts gear hits the shelves. But for now, go grab yourself a StockCharts hat or a custom S'well water bottle before the summer weather heats up!

ChartCon Just Keeps Getting Better

I’m thrilled to announce that we’ve just added another featured speaker to our already incredible lineup for ChartCon 2018. Renowned momentum trader and world-class educator, Mary Ellen McGonagle, will be joining us on stage to share the unique strategies she’s used throughout her long and successful career both on and off Wall Street. I can’t wait to see what Mary Ellen has in store for us, and this wonderful addition to the conference is only making me more eager for August to arrive.

As I mentioned the other week, we’ve now posted the finalized agenda for ChartCon (including presentation titles) online. If you haven’t yet had a chance to take a look at the list of speakers or the agenda, you don’t want to miss it. Head over to the ChartCon page now to take a look.

Let's Get To Know Each Other

Hey, have you ever wanted to learn more about StockCharts? How we got started? Who we are or why we do what we do? Well, I encourage you to visit our new About Us page, where you can read a brief history of the company, understand our mission, and see what makes StockCharts unique. Plus, you can “meet the team” and get to know the folks on the other side making the tools and features you know and love. Check it out!

Until next time,

Grayson Roze

Grayson Roze

StockCharts.com

Having trouble seeing this email? Click to view online

This Week's Articles

The Market Message

Dovish ECB Offsets Hawkish Fed

by John Murphy

Article Image

Editors Note: This article was originally published in John Murphy's Market Message on Thursday, June 14th at 11:39am EST. The Fed raised its short-term rate by a quarter point yesterday as expected. But it also added a fourth rate hike this year which gave its announcement a more hawkish tilt. That had the immediate effect of boosting Treasury bond yields and weakening bond...

Read Article

Art's Charts

Two Continuation Patterns Take Shape in XLI

by Arthur Hill

Article Image

The Industrials SPDR (XLI) has struggled in 2018 and is pretty much unchanged year-to-date. Despite flat performance this year, a pair of bullish continuation patterns are taking shape. Let's look at the key levels to watch going forward. Long-term, the trend is still up because the PPO(50,200,0) is positive, which means the 50-day EMA is above the 200-day EMA. The ETF also recorded a 52-week...

Read Article

The Canadian Technician

Some Consumer Staples Stocks Start Hitting Scans

by Greg Schnell

Article Image

I ran some scans this morning looking for some new breakouts to 1-year highs. With the market pushing up for the last month, these food companies are starting to accelerate. First, Archer Daniels Midland is breaking out to new three year highs. Pinnacle Foods is breaking out above prior year highs. Nomad Foods (NOMD) has a nice chart that looks like it is starting to reaccelerate. If you...

Read Article

Trading Places

Relative Strength Is Your Guide To A Winning Stock Portfolio

by Tom Bowley

Article Image

It seems simple enough. Buy stocks/ETFs that are outperforming the benchmark S&P 500. Well, that's part of it for sure. But it really goes a lot deeper than that. StockCharts.com provides you a myriad of ways to evaluate relative strength. I tend to use relative ratios most of the time so I'll focus on this method in my article. As an example, let's

Read Article

InvestEd Central

Shorting Stocks that Miss Earnings Expectations

by John Hopkins

Article Image

I have found over many years of trading that it is so much more difficult to make money shorting stocks than going long. With the exception of the Dot.com bubble between 2000-2002 and the bear market of 2008-2009 during the Great Recession we've been in a bull market for a long time and trying to short stocks in a bull market is like pulling teeth. However, just like it makes sense to

Read Article

The Traders Journal

Stop! Don't Touch It! Let It Go! Quit Tinkering!

by Grayson Roze

Article Image

I’ve seen this play out time and time again at seminars, conferences, lectures, and courses. Remarkably, the conversation always begins with the exact same seemingly harmless five-word question: “But what if you just…” Those five words prompt me to step up on the soapbox and launch into the “tinkering talk”. A recurring discussion at...

Read Article

DecisionPoint

Historic High on NAAIM Exposure - NDX Scoreboard All Buy Signals

by Erin Swenlin

Article Image

On Friday, the weekly charts went "final". With that finalization, the NDX which had been carrying a positive Price Momentum Oscillator (PMO) crossover throughout the week, finally posted the IT PMO BUY signal on its DP Scoreboard. Additionally, sentiment charts were very interesting this week. The National Association of Active Investment Managers (NAAIM) posted the 3rd highest market exposure...

Read Article

Bookstore Special

RRG Charts

The BIG picture in ONE picture

by Julius de Kempenaer

Article Image

Relative Rotation Graphs® originally emerged out of my work on sector (rotation) analysis while employed as a sell-side analyst providing services to institutional clients. Shortly after the first introduction as a tool to visualize sector-rotation a lot of other possibilities to use RRGs sprung to mind. One of the first ideas was to use a Relative Rotation Graph at the highest level of an...

Read Article

Register Now for ChartCon 2018!

See More Articles …

Become a Member

Become a Member

Unlock All of Our
Tools and Features

  • + Larger, Full-Screen Chart Sizes
  • + Intraday Charts with Real-Time Data
  • + Exclusive, Members-Only Commentary
  • + Custom Technical Scans and Alerts
Free 1-Month Trial
Visit ChartSchool

About ChartWatchers

ChartWatchers is our free, twice-monthly newsletter for online investors and StockCharts users. Whether you are brand new to charting or a seasoned analyst, each edition of ChartWatchers brings you insightful, expert commentary from the industry's leading technicians. See what's really happening in the markets through their eyes and gain an edge in your own investing.

f t
For more information about the ChartWatchers Newsletter or to subscribe for free, Click Here
This email was sent to [email]. Need the newsletter sent to a different email address?
Simply unsubscribe your current email, then re-subscribe using the new address.
Click Here to instantly unsubscribe