
|
 Relative Rotation Graphs® originally emerged out of my work on sector (rotation) analysis while employed as a sell-side analyst providing services to institutional clients.
Shortly after the first introduction as a tool to visualize sector-rotation a lot of other possibilities to use RRGs sprung to mind.
One of the first ideas was to use a Relative Rotation Graph at the highest level of an investor's decision tree, Asset Allocation.
The first decision someone has to make whether he (or she) wants to invest or stay with a savings account. But once the decision to invest has been made, the next decision is to decide "in what?"
Intermarket Analysis
Recently I have started to re-read and work my way through John Murphy's latest book on Intermarket Analysis. If you haven't studied that work yet please do so as it will help you to understand how, pretty much all, world markets are related to each other. And, more important, how we can use that knowledge to our advantage while managing investment portfolios.
Personally, I believe that a good investment portfolio should have allocations to more than just stocks but even if you only run a stock portfolio, knowing what happens in the world around you will be of benefit.
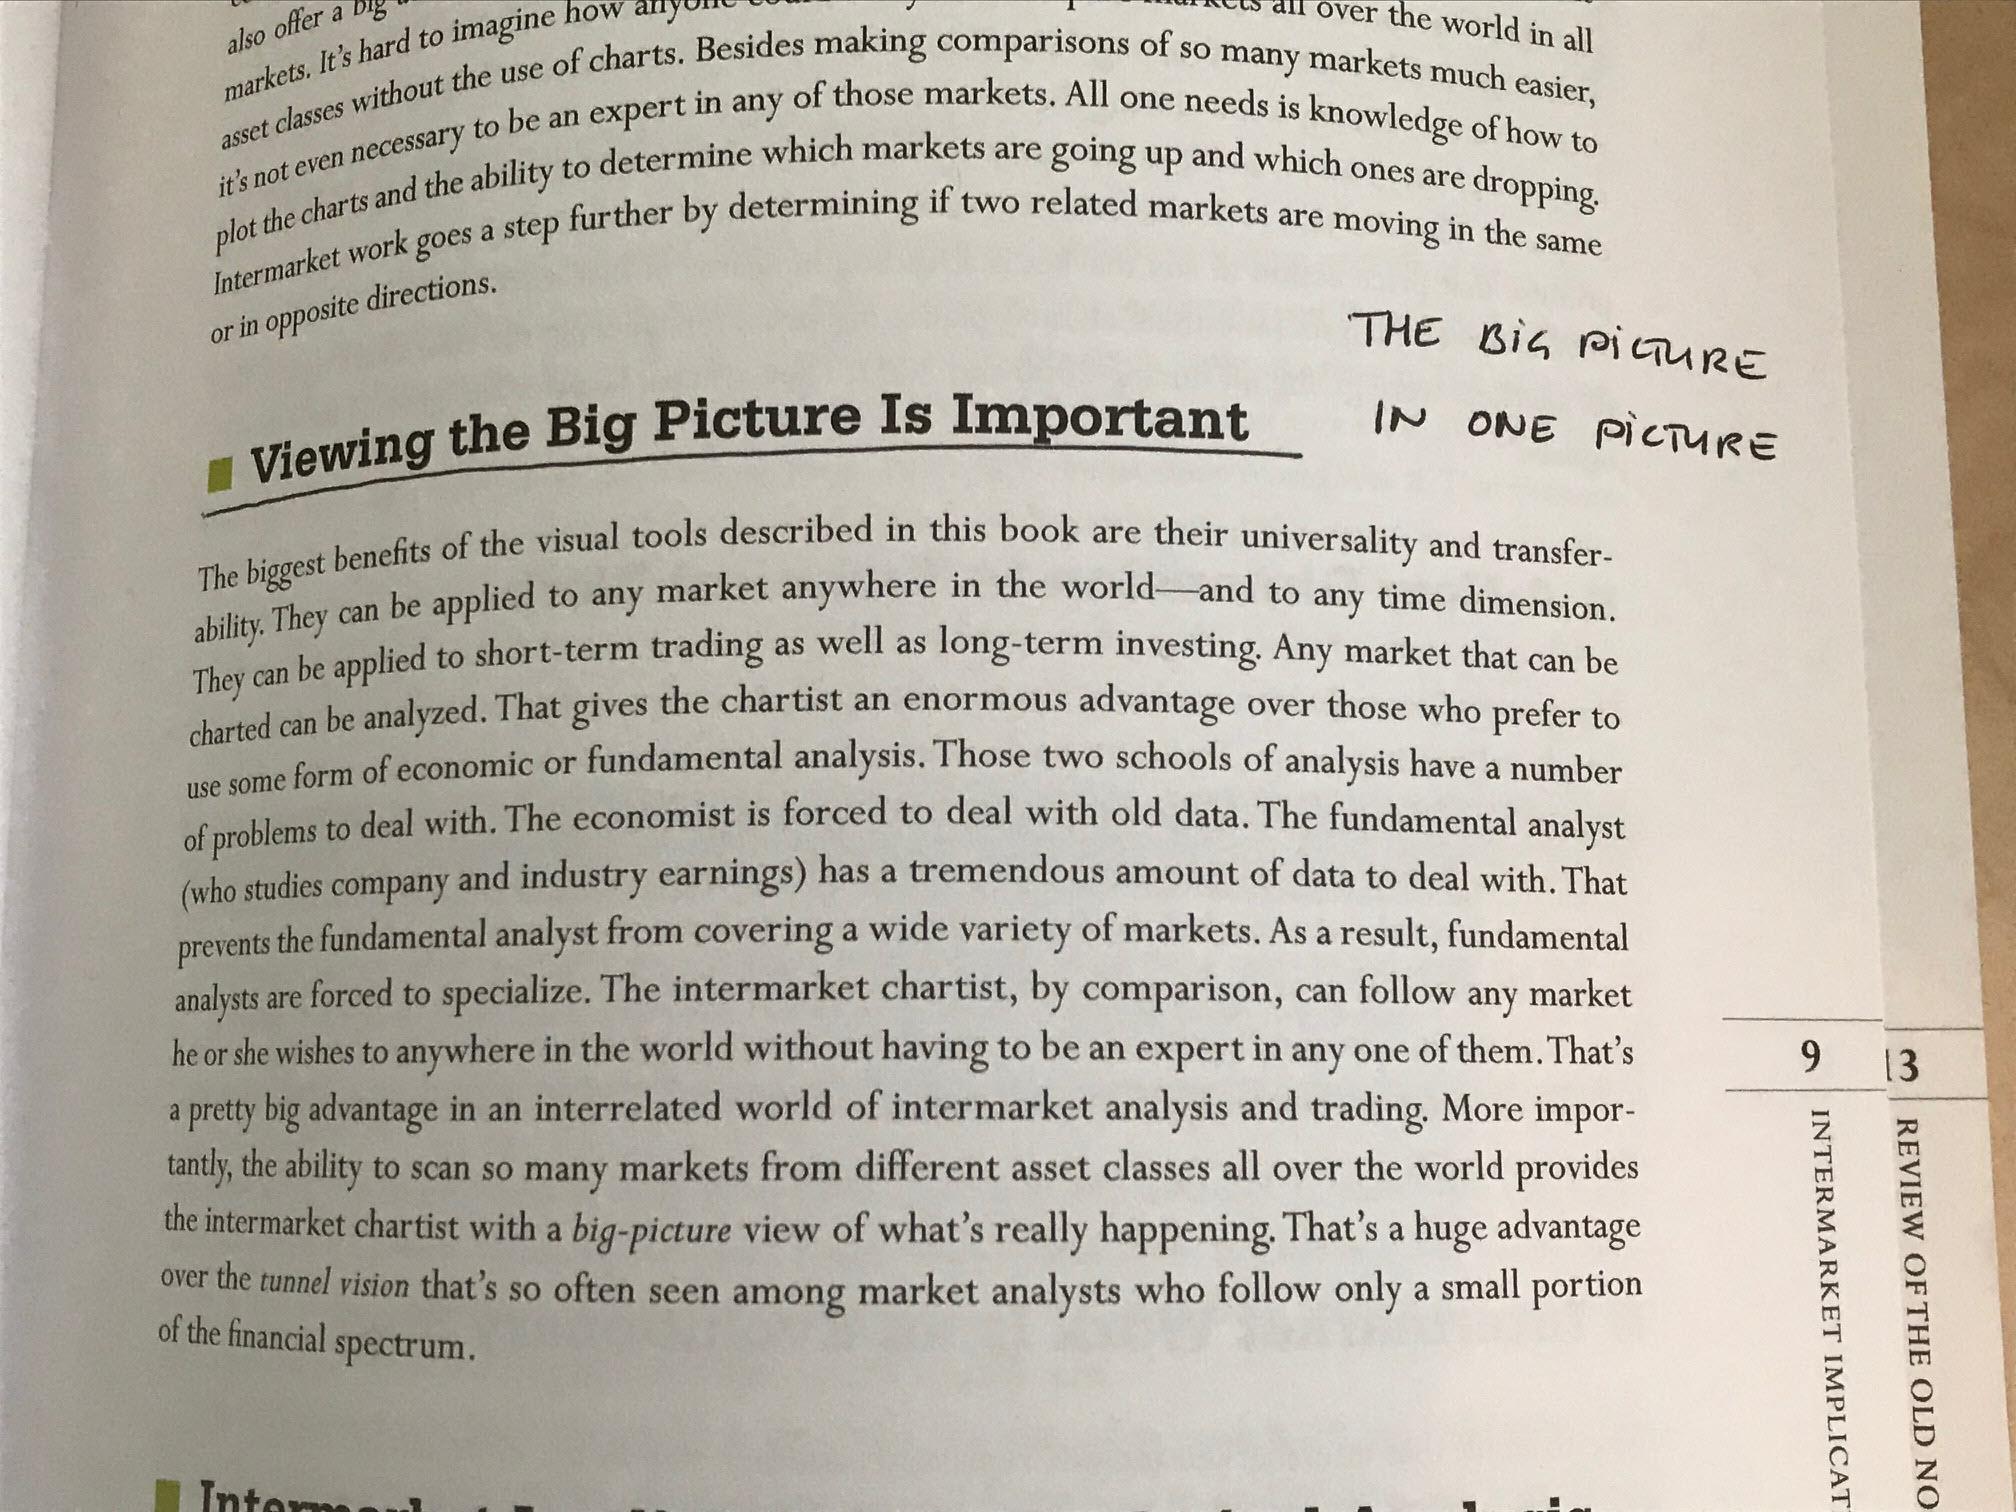
The shot below shows an excerpt of one of the first pages of the book with the statement that
Viewing the big picture is important
Which immediately reflects for me as one of the slogans or taglines I have been using since the early days of Relative Rotation Graphs is
RRG® shows "The BIG picture in ONE picture"
Right from the bat, John talks about Asset Allocation and how investors should look at the different relationships between markets to benefit from know positive or negative correlations.
Asset Classes
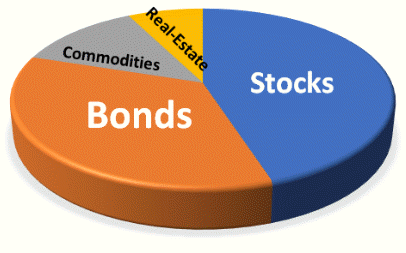
In his work John identifies four asset classes:
- Stocks
- Bonds
- Commodities
- Currencies
Those of you who are familiar with my RRG-Blog here on the Stockcharts.com site may know that I write about asset allocation using Relative Rotation Graphs from time to time to get an idea on what is going on in the relationships between different markets.
For these posts on the RRG-Blog, I use the universe as shown on the chart below.
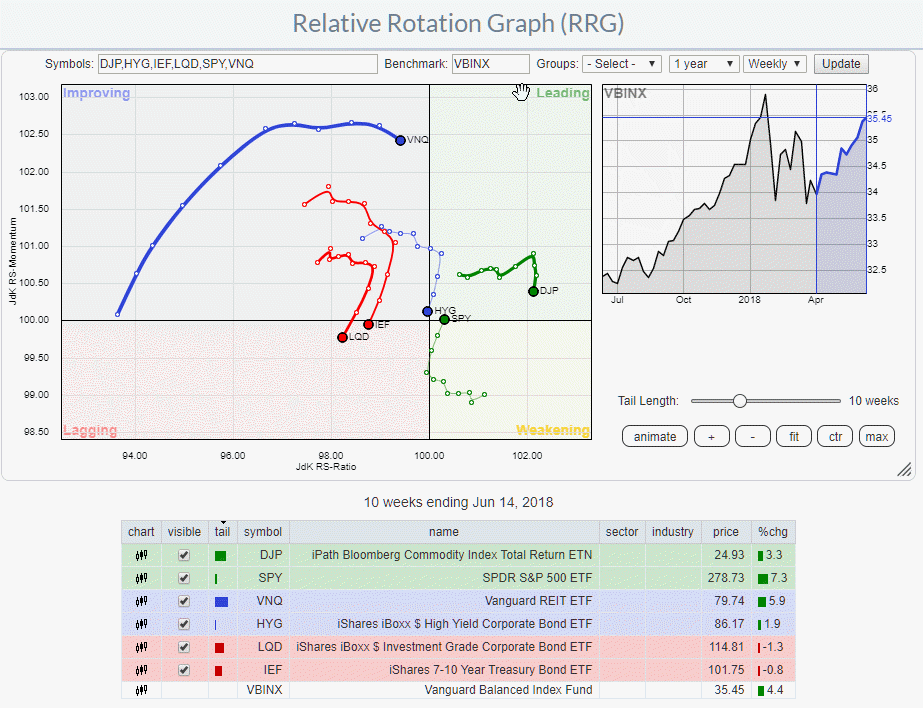 It is focussed on US markets and less internationally orientated (that's another project to work on).
For stocks, SPY is the ETF of choice as a good representation for the US equity market. The asset class "bonds" I have broken down into three different categories. IEF as a proxy for the US Government bond market, LQD for US corporate bonds and HYG for the High Yield market.
For commodities, I always use DJP which tracks the Bloomberg Commodity Total Return Index. So far I always included VNQ as a proxy for Real-Estate. With Real-Estate now included in the S&P 500 sectors and re-thinking the fact that VNQ represents a basket of REITs and not the hard asset real estate (brick and mortar buildings without financing), it may be better to include Real-Estate as a sector under stocks. Not sure yet what the best way of doing this will be.
To facilitate and encourage the use of RRGs for Asset Allocation analysis I have added this universe to the drop-down with pre-populated universes that are available for Stockcharts members. To align with John's asset classes I have also added $USD to the asset classes in that universe. This option should become available shortly.
As you know you can easily show or hide tails from the display by (un-)checking the tick-boxes in the table below the graph.
Benchmark
A Relative Rotation Graph always needs a benchmark as the center of the rotation. There are many ways to choose a benchmark, I probably should dedicate an article to that subject one day...
As this setup will help you decide which asset classes to include or not include or to overweight or underweight inside your portfolio I think that the benchmark should be a "typical portfolio". For most people a typical portfolio means a combination of stocks and bonds. RIAs and wealth advisers very often use a 60% stock, 40% bond portfolio as a balanced model-portfolio.
The VBINX ETF (Vanguard Balanced Index Fund) tracks such a portfolio and is a perfect benchmark to use for asset allocation setups.
Stocks over bonds (still)
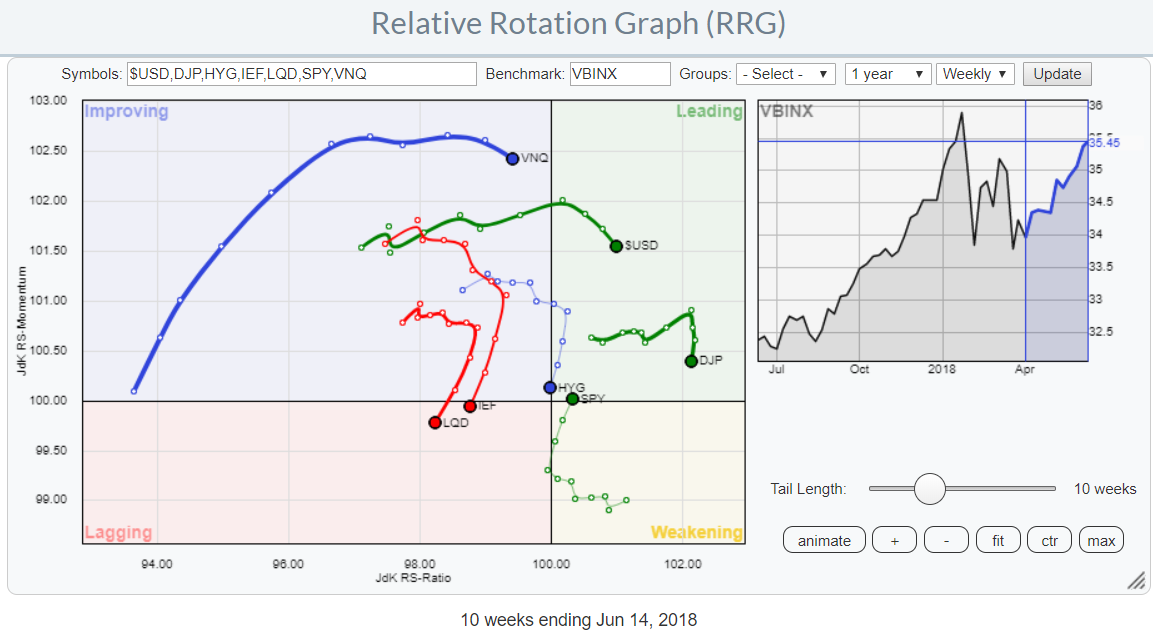 looking at the RRG above the biggest takeaway for the moment, I think, is the contrarian rotation of SPY and IEF which clearly favors Equities over bonds for the time being.
The graph below isolates the two asset classes from the universe and shows them with a longer tail.
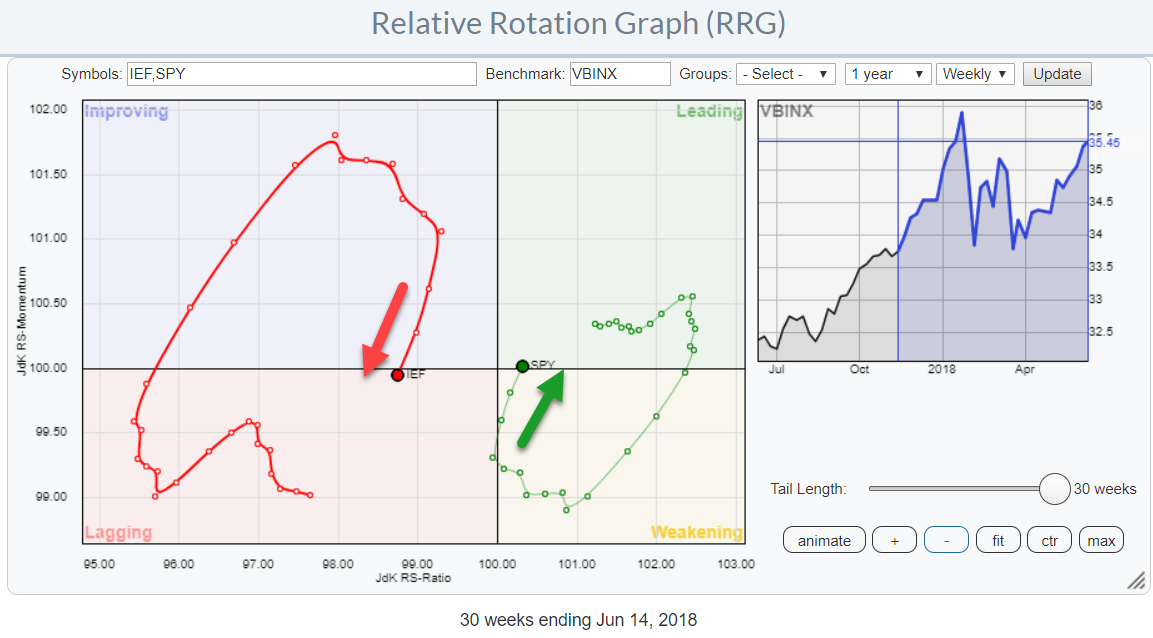
A complete rotation at the right side of the RRG, Leading-Weakening-Leading indicates a strong relative uptrend that just went through a correction within that up-trend. Vice versa a complete rotation on the left side of the graph Lagging-Improving-Lagging indicates a strong relative down-trend that went through a recovery within that downtrend.
The rotations of SPY and IEF have both just completed such a rotation. IEF, Government bonds on the left side and SPY, stocks, on the right side. For the time being the preference, therefore, lies once again with equities over bonds.
Let me know what you think of this usage of RRG in the comments? If you want to receive a notification when a new article in the RRG blog is published? Simply "Subscribe" and leave your E-mail address.
Julius de Kempenaer | RRG Research
RRG, Relative Rotation Graphs, JdK RS-Ratio, and JdK RS-Momentum are registered TradeMarks ®; of RRG Research
Follow RRG Research on social media:
If you want to discuss RRG with me on SCAN, please use my handle Julius_RRG so that I will get a notification.
