- Market Overview: DIA, IWM, QQQQ, SPY, $VIX, $NAA200R, AAII Sentiment, AD Line and Ad Volume line
- Click here for today's video.
- The next update will be Tuesday (July 21) by 7AM ET.
*****************************************************************
Still Within Trading Ranges
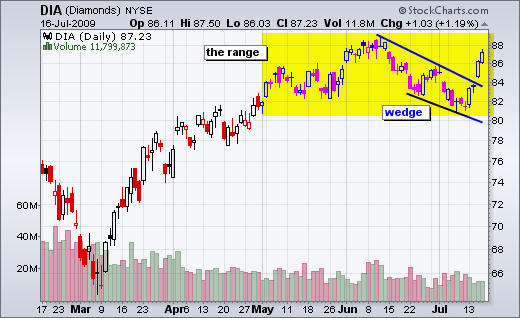
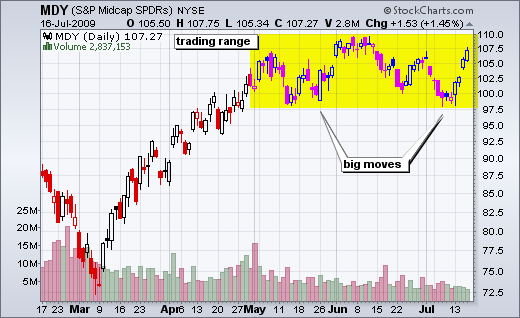
Despite this week's surge, I am still not buying into the bullish case over the next few months. Even though the bulk of the evidence is bullish, resistance levels are nigh and the winds can change quickly. A look at the daily charts reveals trading ranges for the S&P 500 ETF (SPY), Russell 2000 ETF (IWM), S&P MidCap SPDR (MDY) and Dow Diamonds (DIA). Only the Nasdaq 100 ETF (QQQQ) and techs broke to new highs. Of these five ETFs, four are still below their June highs and only one broke above its June high. The first chart shows DIA with a wedge breakout over the last four days. This breakout certainly looks impressive with its gap, but the ETF remains within its 11 week range and short-term overbought. The second chart shows MDY with another big surge off support. The first such surge occurred in late May with a gap above 105. Despite this "strong move", MDY met resistance around 110 in early June and declined back to support in early July. This is evidence that not all big surges hold.
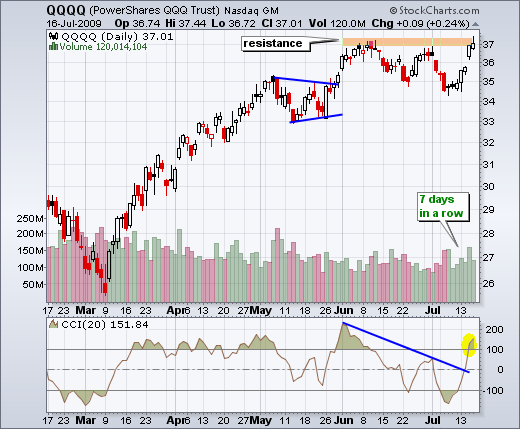
QQQQ moved above its June high intraday, but fell back in the final 15 minutes of trading. QQQQ, DIA, SPY and MDY trade until 4:15PM ET. While a breakout would be "technically" bullish, I would not expect a big run after a breakout. First, the ETF is up over 7% in seven days straight. Second, CCI is already overbought. Third, breakouts just ain't what they used to be. A breakout is still a show of strength, but it is not necessarily a buy signal. At this stage, the most I would expect is a choppy advance with pullbacks after new highs (breakouts). QQQQ broke triangle resistance at 35 in late May and surged to 37 in early June. However, it was already back to 35 in late June.
*****************************************************************
Traders Market
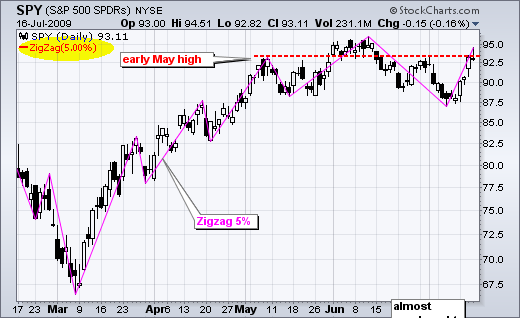
Since the March low, the S&P 500 ETF (SPY) has experienced 9 moves of at last 5%. On average, that means two 5% moves per month or a 5% move every 2-3 weeks. There have been four 5% moves (two up and two down) since early May, but the S&P 500 is still trading near its early May high. Talk about a traders market that has gone nowhere. The chart below illustrates these moves with the Zigzag indicator set at 5%. I would even venture to say that the head-and-shoulders pattern is still alive. Kicking? No. Alive? Yes, but barely. After all, SPY failed to hold its gains and closed down on Thursday. There may be resistance yet from the May and July highs (red dotted line).
*****************************************************************
Mind the gaps!
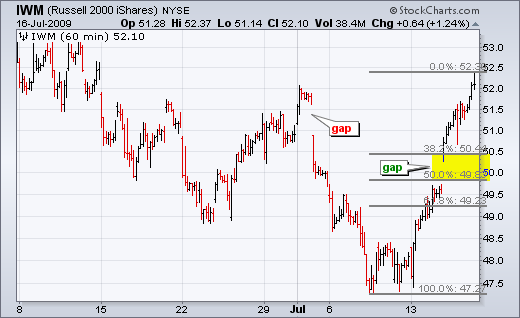
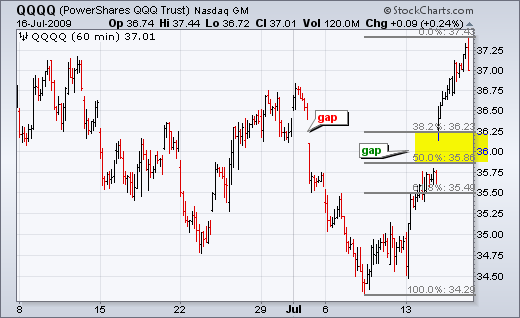
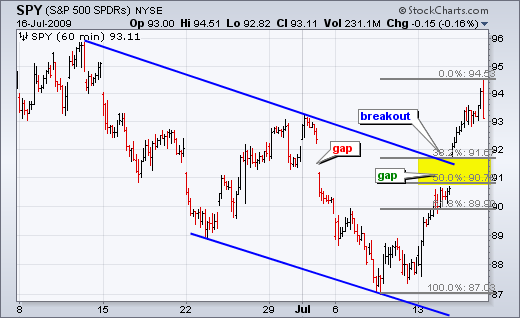
That is what you hear when boarding the London tube at certain stations. It refers to the gap between the train and the platform. As far as the major index ETFs are concerned, traders may want to mind (watch) this week's gap. IWM, SPY and QQQQ all surged, gapped higher and surged again. A robust gap/breakout should hold. All three ETFs became short-term overbought this week, which makes them ripe for a pullback or consolidation. The gaps and 38-50% retracement zones mark the first support levels to watch (yellow areas). A pullback to the 38% retracement and top of the gap zone would alleviate overbought conditions. For potential long positions, this would also improve the risk-reward ratio and decrease the chances of a whipsaw.
*****************************************************************
Indicator Overview
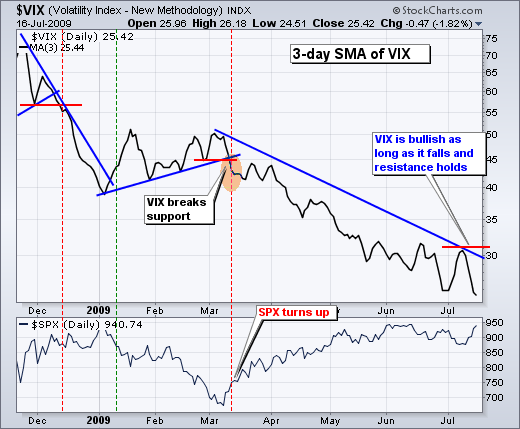
After reviewing my key market indicators, I must say that the bulk of the indicator evidence is still medium-term bullish. The S&P 500 Volatility Index ($VIX) and Nasdaq 100 Volatility Index ($VXN) are both trending lower. With this week's surge, the 3-day SMAs for the VIX and VXN moved to new lows. Strength in stocks is normally associated with falling volatility. No bearish signal until there is an upside breakout in volatility.
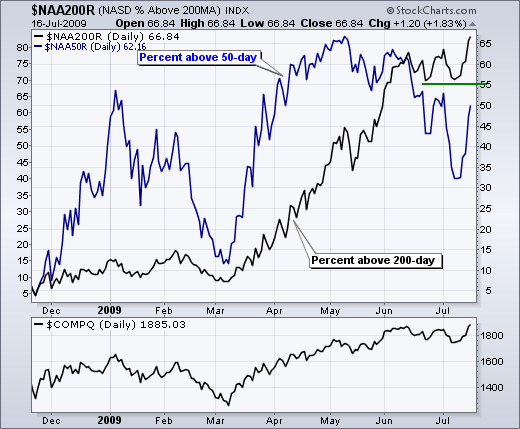
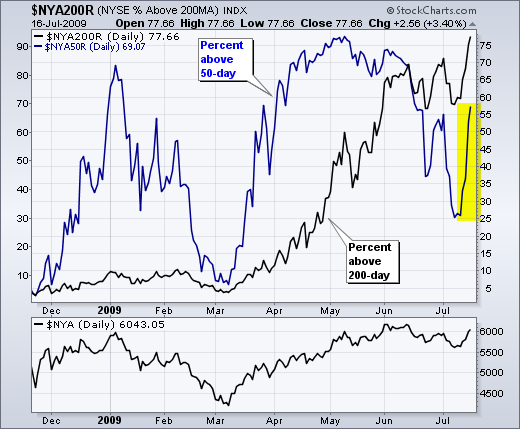
The percent of stocks above their 200-day moving average remains high. Almost 67% of Nasdaq stocks are above their 200-day moving averages, while over 77% of NYSE stocks are above their 200-day moving averages. I would not expect an extended correction until this indicator breaks below support at 55%. With this week's surge, the percent of stocks above their 50-day moving averages improved dramatically.
There are still a lot of bears out there. As of July 15th, the AAII survey shows 28.68% Bullish, 24.26% neutral and 47.06% bearish. Put another way, there are not very many bulls in this survey. The relatively low bullish reading and relatively high bearish reading is actually bullish for the market. This contrarian indicator suggests that many participants are still on the sidelines could provide fuel for the rally as they change their minds.
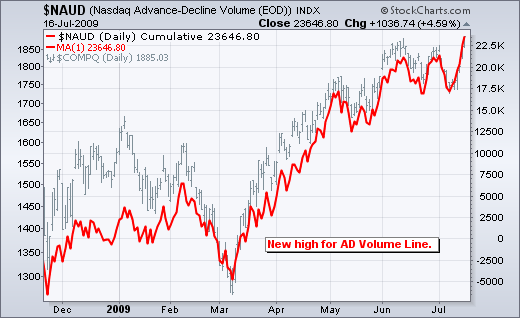
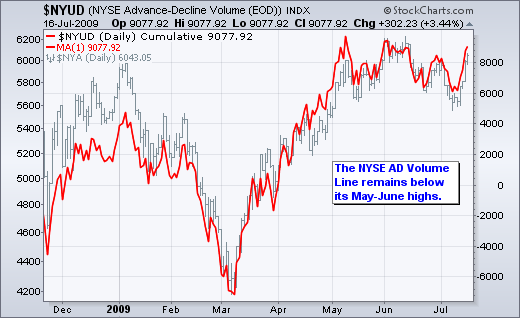
The AD Line for the NYSE and the AD Volume Line for the Nasdaq both moved to new highs for the current move. However, the AD Volume Line for the NYSE and the AD Line for the Nasdaq have yet to exceed their June highs. It is a strange combination or non-confirmation. Large-caps dominate volume and the AD Volume Lines. This means large-caps are leading the Nasdaq, but not the NYSE. In contrast, small and mid-caps are leading the NYSE, but not the Nasdaq. Go figure.
*****************************************************************

