- Market Overview
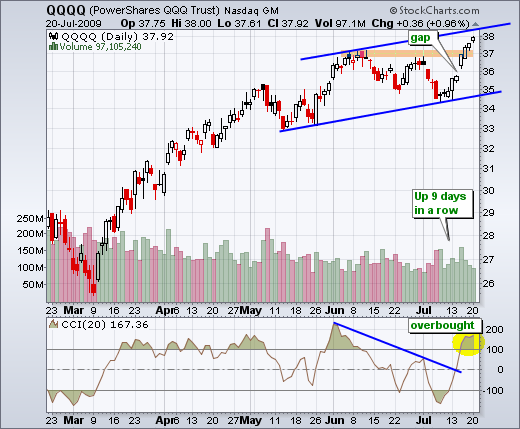
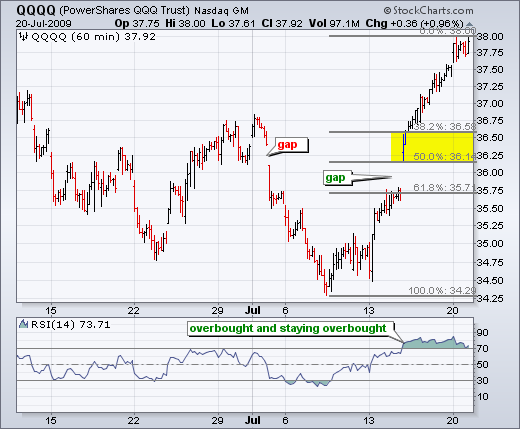
- QQQQ breaks June high
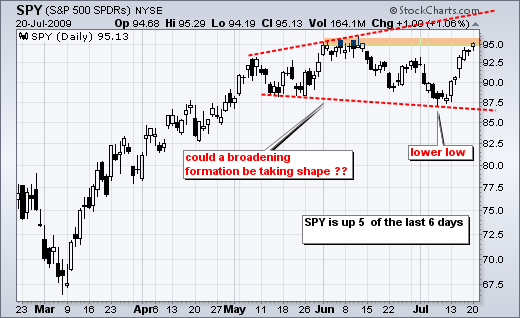
- SPY hits resistance
- Stocks short-term overbought
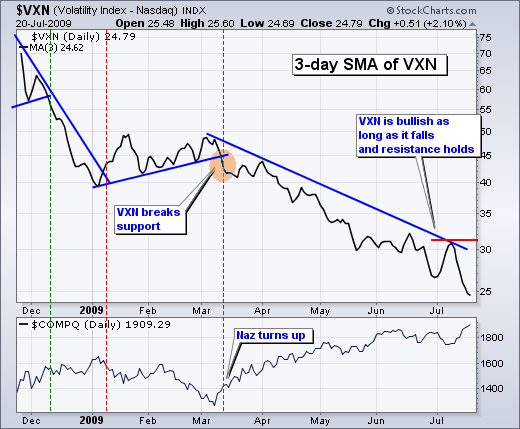
- VIX hits new low,
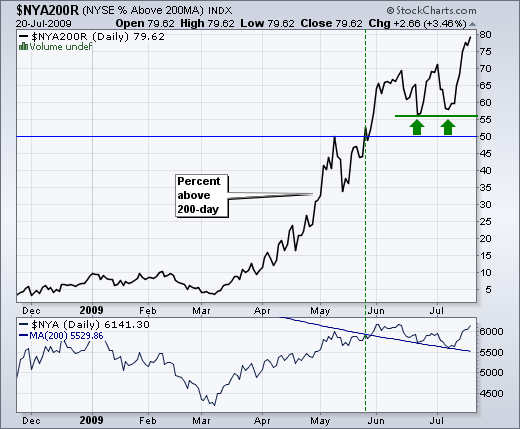
- Percent above 200-day hits new high
- Net New Highs expand
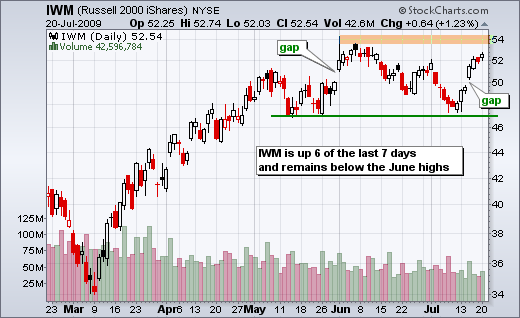
- Small-caps lag large-caps.
- Link to today's video.
Chart Worth Watching will be posted around 9AM. The next update will be Friday (July 24) by 7AM ET.
*****************************************************************
Overbought and At Resistance
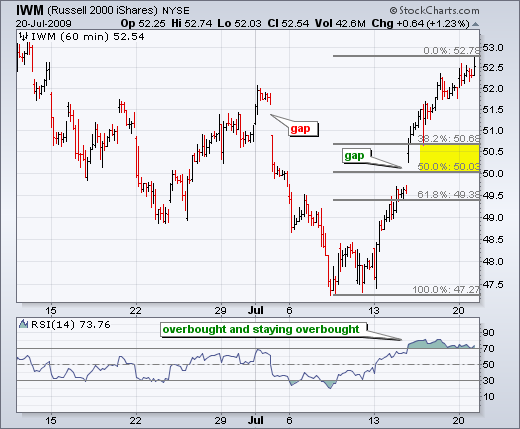
The bulk of the medium-term evidence remains bullish, but overbought conditions and resistance favor a pullback for the short-term. The Nasdaq 100 ETF (QQQQ) broke above its June highs, but the other major index ETFs have yet to break above their June highs. The S&P 500 ETF (SPY), Russell 2000 ETF (IWM) and Dow Diamonds (DIA) could run into resistance from the June highs. In addition to resistance, stocks are overbought after a big surge the last 7-9 days. Techs are especially overbought with the Nasdaq up 9 days in a row.
*****************************************************************
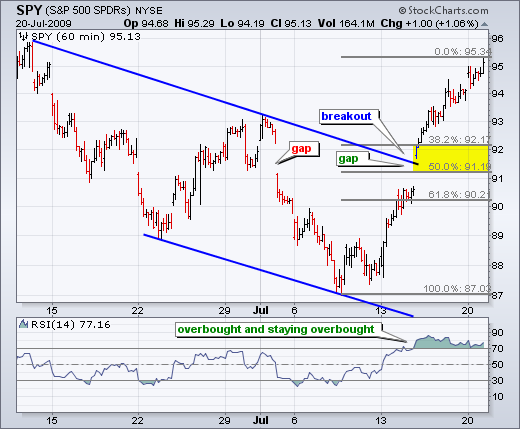
Short-term Parabolic Moves
It is nothing but straight up on the 60-minute charts. These moves are so steep that they resemble a parabolic advance. Over the last nine days, SPY is up 9%, IWM is up 9.3% and QQQQ is up 10.7%. We do not need an oscillator to tell us that these ETFs are overbought. Nonetheless, I am showing 14-period RSI on these 60-minute charts for reference. Notice how RSI moved above 70 last week and remained above 70 for four days. As noted before, readings above 70 are both overbought and bullish because it takes continued strength to keep RSI above 70. RSI would move below 70 if trading turned flat or stocks moved lower. Therefore, the first sign of weakness would be a move below 70 in 14-period RSI on the 60-minute chart. The yellow areas show potential support zones on a pullback.
*****************************************************************
Indicator Overview
The S&P 500 Volatility Index ($VIX) and Nasdaq 100 Volatility Index ($VXN) continue to trend lower. Both recorded new lows over the last few days and these indicators remain bullish for stocks.
The percent of Nasdaq and NYSE stocks above their 200-day moving average remains bullish. Over 75% of NYSE stocks and over 65% of Nasdaq stocks are above their 200-day moving average. While these readings are getting overbought, we have yet to see signs of weakness. Both remain firmly bullish as long as they hold above 55%.
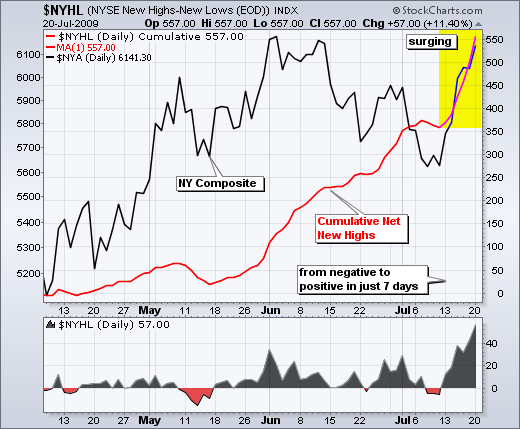
Net New Highs continue to expand on both the Nasdaq and NYSE. NYSE Net New Highs surged above +50 over the last seven days. In fact, this indicator was negative just seven days ago. The top window shows cumulative Net New Highs making a sharp move higher. Expanding new 52-week highs and contracting new 52-week lows is bullish overall.
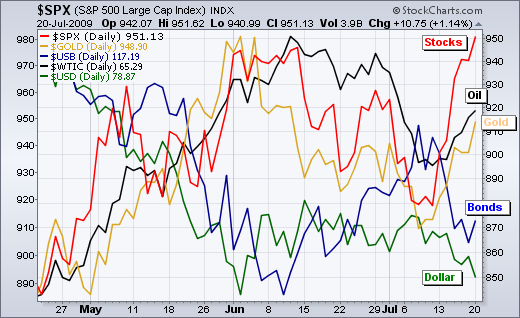
The intermarket forces favor stocks right now. Over the last two weeks, we have seen stocks (S&P 500), gold and oil move higher. In contrast, bonds ($USB) and the US Dollar Index ($USD) have moved lower. This shows money moving out of bonds and into stocks. It also shows money moving out of the Dollar and into gold. Strength in the stock market points to strength in the economy and this increases the demand for oil.
*****************************************************************
Small-caps Lagging Large-caps
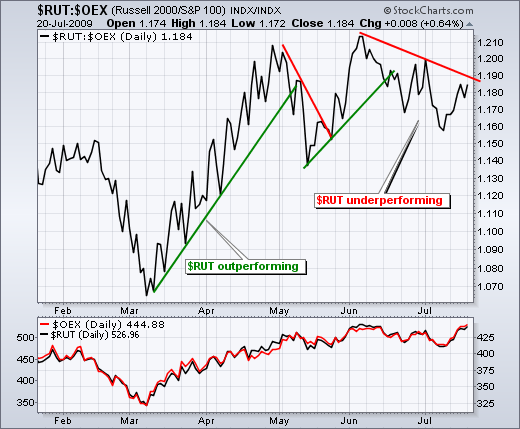
Even though techs are leading the market higher, relative weakness in small-caps presents a potential problem for the bulls. The price relative ($RUT:$OEX Ratio) shows the performance of the Russell 2000 ($RUT) relative to the S&P 100 ($OEX). RUT represents small-caps, while OEX represent large-caps. The price relative peaked in early June, formed a lower high in early July and a lower low. Small-caps have been lagging for 6-7 weeks now. We can also see some relative weakness on the actual price charts. OEX (red) edged above its June high yesterday, but RUT (black) has yet to exceed its June high.
*****************************************************************

