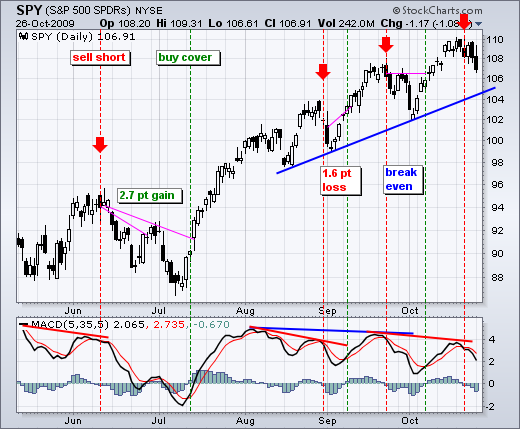
After a big surge in July, the S&P 500 ETF (SPY) has been zigzagging higher since early August. Consider the zigs as advances and the zags as declines. Each advance (zag) forges a higher high, while each decline (zig) reverses above its prior low. This series of higher highs and higher lows means a medium-term uptrend is in place.
With three reaction lows in as many months, I can draw a trendline extending up from the August low. This trendline marks the first support around 105 over the next few days. Beyond 105, the early October low marks the next support level around 102.
The bearish signal in MACD (5,35,5) remains in play and SPY is trading below last week's low. MACD remains below its signal line, which reflects the short-term downtrend in SPY. At this point, it would take a bullish signal line crossover to call for a re-evaluation of this bearish signal. Keep in mind that this is a short-term bearish signal within a medium-term uptrend. At some point a short-term decline will extend far enough to trigger a medium-term reversal. It ain't happened yet though.
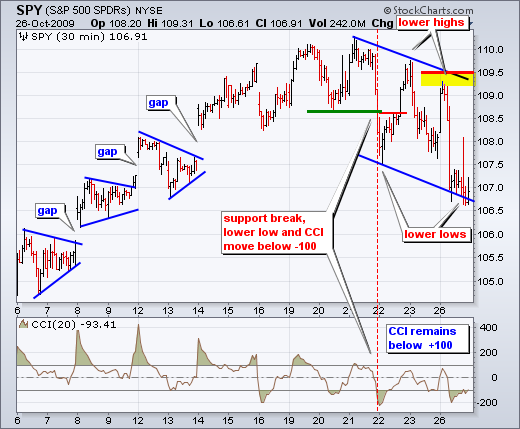
On the 30-minute chart, trading has been quite volatile as SPY works its way lower. Nevertheless, the chart clearly shows a series of lower lows and lower highs the last four days. In addition, CCI remains below +100. Short-term momentum and trend are currently bearish. To reverse this downtrend, I would require CCI to break above +100 AND SPY to close above 109.5. From current levels, a move above 109.5 would require a gain greater than 2%. Such a large gain could not be ignored. This analysis is covered in the video for October 27th.


