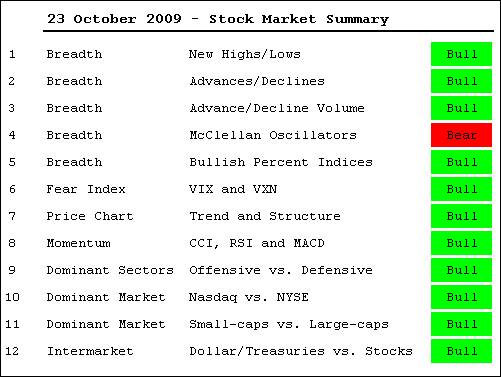
-Bulk of the evidence remains bullish
-Weak upside breadth on Monday and Thursday
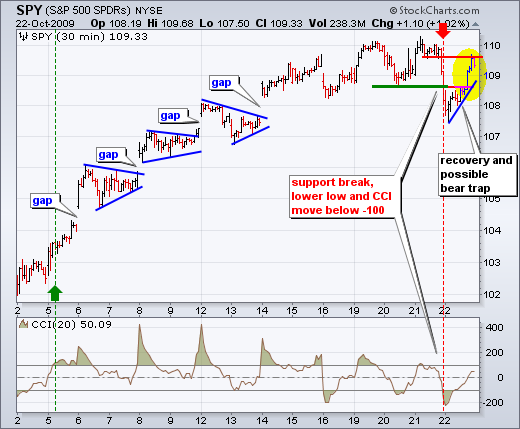
-SPY and IWM reverse short-term uptrends
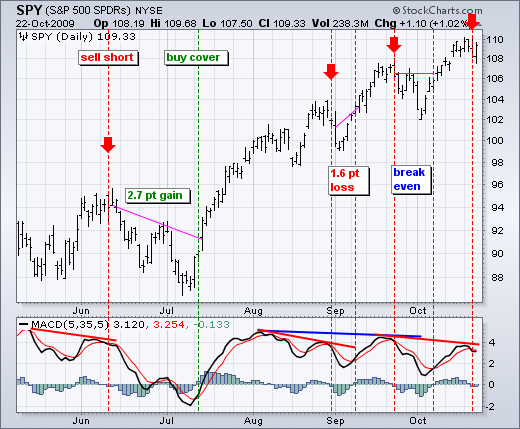
-A MACD(5,35,5) signal for SPY
-SPY remains in Wave 4 target zone
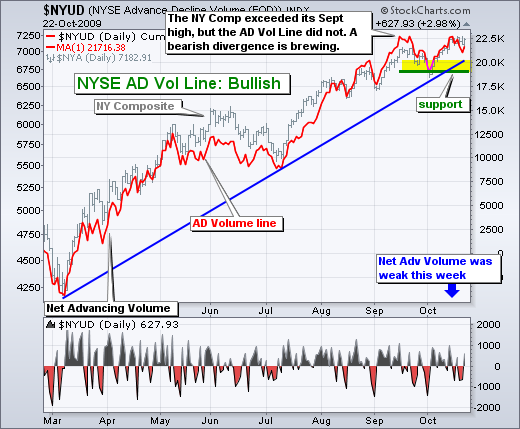
-NYSE AD Volume Line does not confirm
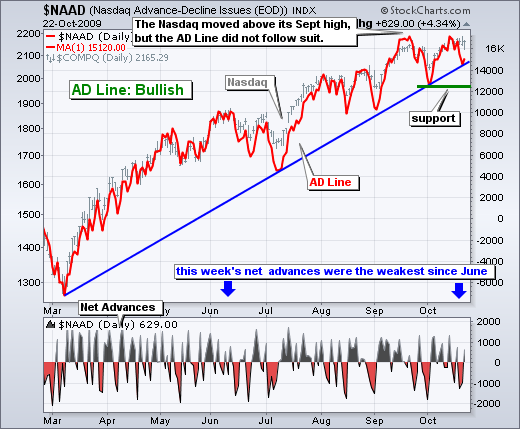
-Nasdaq AD Line fails to exceed September high
-Dollar falls, but short-term rates firm
-Gold consolidates after sharp gains
-Oil remains overbought and ripe for a pullback
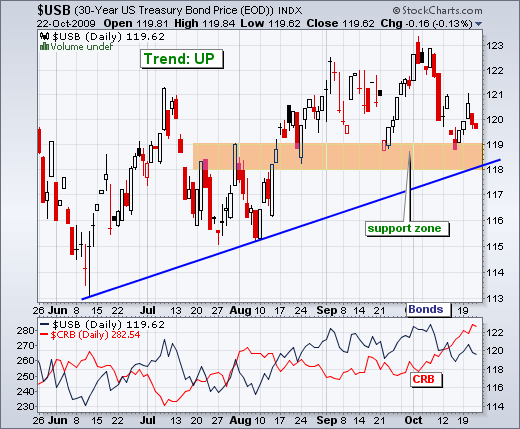
-Bonds test key support zone
-Breadth chart page updated (click here)
-Click here for the video page.
-Next commentary: Short-term update on Monday by 7AM ET.
*****************************************************************
Evidence remains bullish
The bulk of the evidence remains bullish. There are, however, some cracks starting to appear in the bullish case that could have short-term consequences. First, we have non-confirmations in the NYSE AD Volume Line and Nasdaq AD Line. Second, the McClellan Oscillators remain bearish. Third, MACD (5,35,5) moved below its signal line after a negative divergence. Even with a few areas of weakness, there is not enough evidence to turn bearish at this stage. Keep in mind that the market summary is designed to capture current conditions and the underlying trend. By definition, it is designed for trend following, not top-picking.
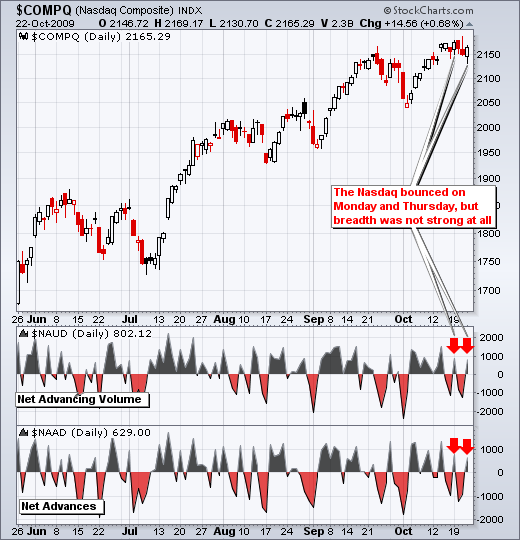
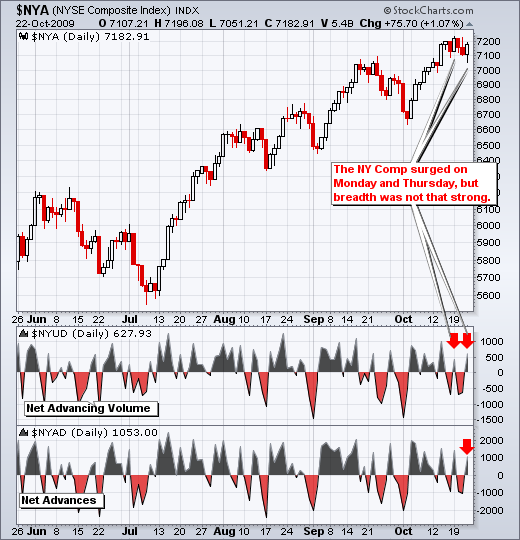
Even though the medium-term situation remains bullish, SPY triggered a short-term bearish signal with MACD(5,35,5). More importantly, this is backed up by weakness in the indicators mentioned above. It is also worth noting that upside breadth this week was not strong at all. Stocks moved higher on Monday and Thursday, but Net Advances and Net Advancing Volume failed to exceed +1000. The stage is set for short-term weakness.
*****************************************************************
Indicator Run Down
-Net New Highs have been positive since mid July. The Cumulative Net New Highs line continues to trend up and remains above its 10-day SMA.
-The AD Lines are trending up, but the Nasdaq AD Line failed to exceed its September high. 1
-The AD Volume Lines are trending up, but the NYSE AD Volume Line failed to exceed its September high.
-The McClellan Oscillators plunged below -50 in early October. Upside momentum in breadth is waning.
-All Bullish% Indices remains above 50%. This means that over 50% of stocks are on P&F buy signals.
-The VIX and VXN are trending lower and moved to new lows this week. There is no sign of fear in the current market environment.
-SPY momentum is bullish with RSI(14) above 50, Aroon(20) in positive territory and MACD(5,35,5) above zero. The bearish divergence is a short-term concern, but we have yet to see a medium-term bearish signal.
-Dominant Sectors: The finance, technology and consumer discretionary sectors, which are the offensive sectors, all exceeded their September highs this month and remain in uptrends.
-Dominant market: The Russell 2000 (small-caps), S&P 100 (large-caps), Nasdaq (techs) and NY Composite (non-techs) all exceeded their September highs and remain in uptrends. The Russell 2000 barely exceeded its September high though.
-Intermarket: The Dollar and short-term rates remain in a downtrend and this has been positive for stocks since March.
*****************************************************************
Short-term Downtrend
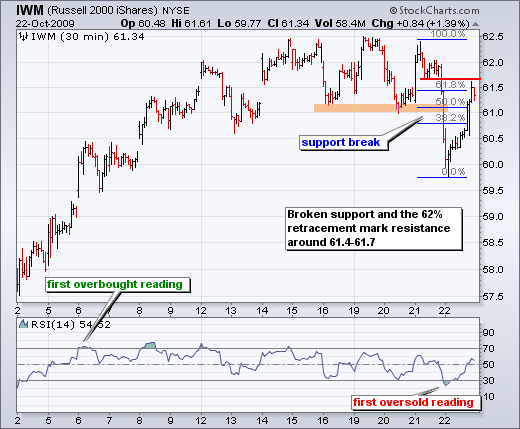
Despite yesterday's bounce, the four major index ETFs remain in downtrends (DIA, IWM, QQQQ and SPY). First, all four broke below short-term support levels with Wednesday's plunge. This means they formed lower lows. Second, all four remain below this week's highs, which means they have yet to record a higher high. Third, 14-period RSI for all four reached oversold levels for the first time since the rally began. Based on the evidence above, it appears that Wednesday's selling pressure was enough to break the bull's back.
Despite a short-term downtrend, the medium-term uptrend remains the big caveat. While pullbacks do occur within medium-term uptrends, short-term bears are fighting a bullish headwind from the bigger uptrend. Medium-term trend reversals begin with short-term trend reversals, but turning medium-term bearish right now would be picking a top. While the risk-reward ratio of such positions is appetizing, the risk of failure is above average because of the bigger uptrend.
*****************************************************************
MACD bearish divergence for SPY
For the fourth time in five months, MACD (5,35,5) formed a bearish divergence and moved below its signal line. Notice that I am using MACD (5,35,5) instead of default MACD, which is set at (9,26,9). The first signal in June resulted in a 2.7 point profit, but the prior two signals resulted in a 1.6 point loss and a breakeven trade. Looking at the June-July trade in detail, it would have been possible to book partial profits after the first decline (2-3 points) and then set the stop for the remainder at break even. It is prudent to reset stops to breakeven as soon as possible. Limiting losses is perhaps the single most important aspect of trading.
MACD closed below its signal line on Wednesday. This means possible entry would be at the close on Wednesday or on Thursday's open. At this point, the risk of a bad signal is above average. The medium-term trend remains up and Thursday's sharp rebound was a warning to bears. A close above 110.5 would be enough to negate this MACD signal. For newbies, I would suggest following signals and paper trading before acting with real money.
*****************************************************************
Wave 4 uptrend continues
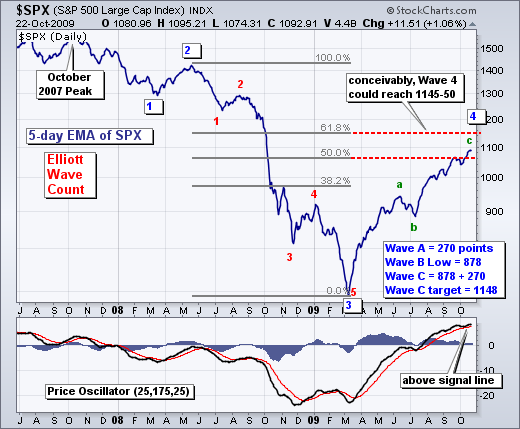
There is no change in the long-term outlook on three year chart. The S&P 500 is entering the 50-62% retracement zone with the next upside target around 1145-1150. I still "think" we are in a Wave 4 advance of a 5-wave decline. Wave 4 is taking on an ABC pattern. Wave C can be equal to Wave A, which would project a move to around 1148. See the math on the actual chart. As long as the medium-term evidence remains bullish, the 1145-1150 area marks the next target for the S&P 500. I would also expect the four major index ETFs to follow the S&P 500.
*****************************************************************
Breadth remains bullish overall, but...
As noted in the stock market summary, the NYSE AD Volume Line and Nasdaq AD Line failed to confirm recent highs in the underlying indices. In other words, the NY Composite and Nasdaq both exceeded their September highs this month, but the NYSE AD Volume Line and Nasdaq AD Line did not exceed their October highs. This non-confirmation is a warning sign that parts of the market are not keeping pace. It also means that bearish divergences are brewing in these two indicators. Even so, both remain in clear uptrends and have yet to actually break down. The NYSE AD Line and Nasdaq AD Volume Line also remain in uptrends. All breadth charts were updated today - click here for the breadth chart page.
*****************************************************************
US Dollar Index hits another new low
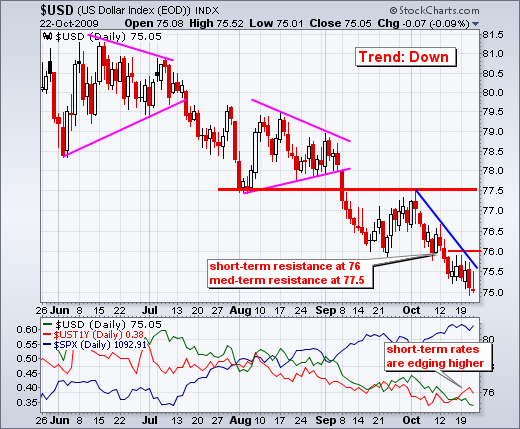
Weakness in the Dollar continues as the US Dollar Index ($USD) recorded a new 52-week low this week. In contrast, the Euro ETF (FXE) hit a new 52-week high and exceeded 1.50 for the first time since early August 2008. Short-term resistance remains at 76. Medium-term resistance remains at 77.5.
Weakness in the Dollar is linked to the decline in short-term interest rates. The bottom indicator window shows the 1-Year Treasury Yield (red) with the US Dollar Index (green) and the S&P 500 (blue). Rates and the Dollar have fallen since March. Stocks have risen since March. In an interesting twist, notice that short-term rates bottomed the second week of October and edged higher the last two weeks. It is not much though, and certainly not enough to spark a Dollar rally. Keep an eye on it though. The employment report is scheduled for November 6th. An upside surprise would cause short-term rates to surge and the Dollar could follow.
*****************************************************************
Gold consolidates with small triangle
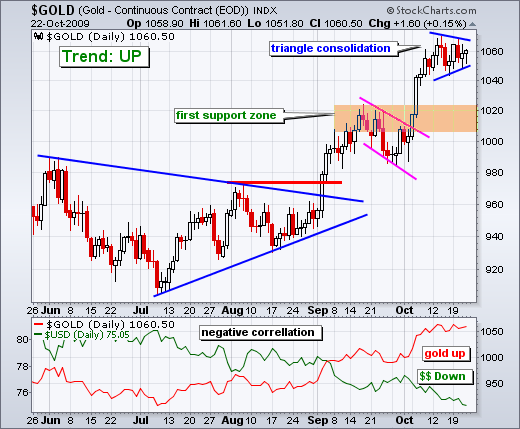
The Gold-Continuous Futures ($GOLD) remains in a clear uptrend as it consolidates around 1060. A consolidation after an advance is typically bullish. It signals a rest within the uptrend. A break above consolidation resistance would signal another continuation higher for bullion. A downside triangle break would argue for a correction of the prior advance. First support remains near broken resistance around 1010-1020.
*****************************************************************
Oil remains short-term overbought
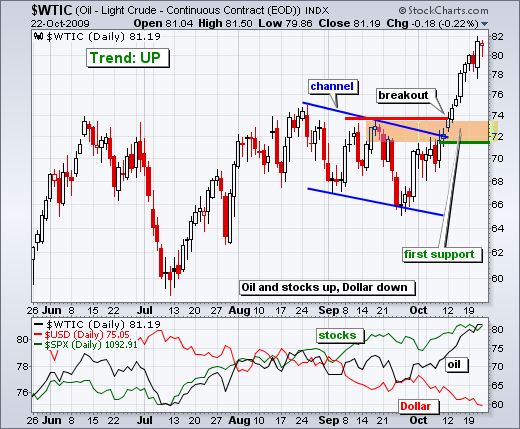
West Texas Intermediate ($WTIC) remains in a clear uptrend, but crude is overbought after a 24% advance in four weeks. Broken resistance around 72-74 turns into the first support zone to watch on a pullback. Crude performance is likely tied to the Dollar and the stock market. A falling Dollar and rising stock market are bullish for oil. Weakness in the Dollar makes dollar-denominated oil more expensive. Strength in the stock market bodes well for the economy and demand for energy.
*****************************************************************
Bonds tests key support zone
It is the moment-of-truth for the bond market as the 30-year Treasury Bond ($USB) tests support around 118-119. Support is holding so far, but a break below 118 would be bearish for bonds. Fundamentally, bonds came under pressure with the big advancing in commodities this month. Continued strength in oil and other commodities would be bearish for bonds, which loathe inflation. Bonds will also be watching the November 6th employment report. Again, an upside surprise in the employment report would send bonds sharply lower and interest rates higher. The stock market has been on a tear since March, but the non-farm payrolls have yet to expand and continue to contract.
*****************************************************************
Thanks for tuning in and have a great weekend!
*****************************************************************

