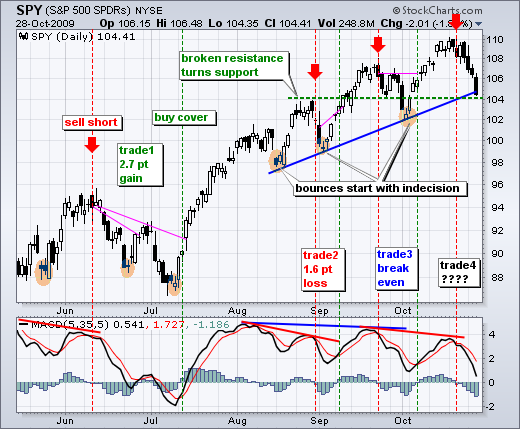
The S&P 500 ETF (SPY) is now down over 5% in the last seven days. With the medium-term trend still technically up and the ETF oversold, traders should be on guard for a bounce or consolidation. Bouncing usually begin with indecision.
The orange highlights show indecisive candlesticks marking reaction lows for prior bounces. At this stage, I would wait for a doji or a candlestick with a small body (narrow range day) before considering the prospects of a bounce. I also see potential for support in the 104-105 area from the August trendline and broken resistance.

Click this image for more details.
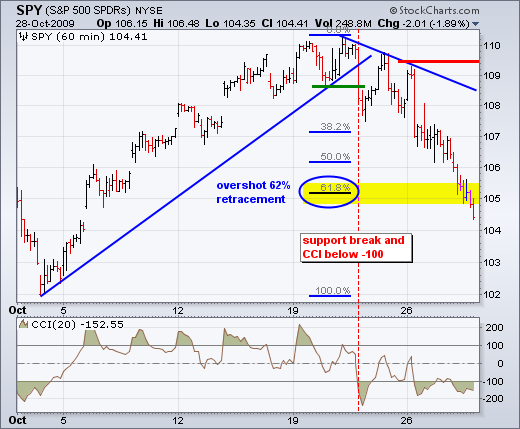
The 60-minute chart captures the prior advance and the current decline. With the move below 105, SPY overshot the 62% retracement mark. This means that SPY has retraced over 62% of the prior advance. Overshoots happen sometimes, especially when momentum picks up steam. With the ETF still near the 62% retracement and near support on the daily chart, the odds of a bounce or consolidation are increasing.

Click this image for more details.
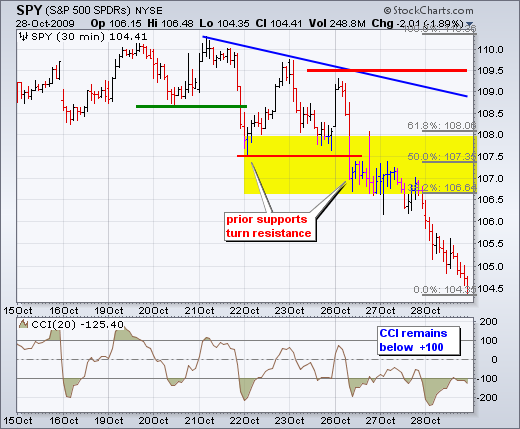
The 30-minute chart captures the current decline. At this point, I will leave key resistance at 109.5. This level will likely come down in a few days. The yellow zone marks the first resistance area. It is big, but I prefer to work with zones after extreme moves. A 38-62% retracement of the current decline would extend to the yellow zone. In addition, broken support levels and the consolidation around 107 confirm resistance in this area.


