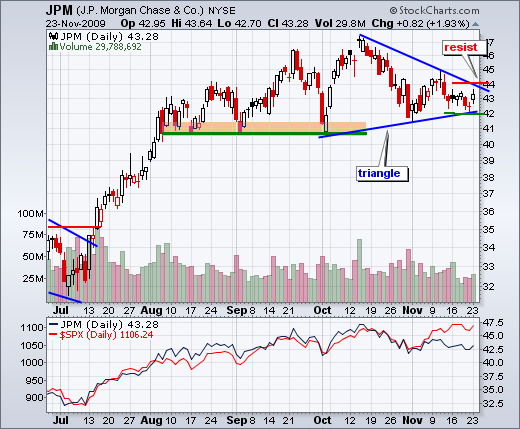
JP Morgan Chase (JPM) is the biggest holding (12.08%) in the Financials SPDR (XLF). As with XLF, JPM is showing relative weakness as it trades well below its October high. The stock is currently testing support from the triangle trendline extending up from the October low. Trading has been real quiet the last six days with a tight range. A break above 44 would be bullish for JPM, and XLF. Conversely, a break below 42 would be bearish for JPM, and XLF.


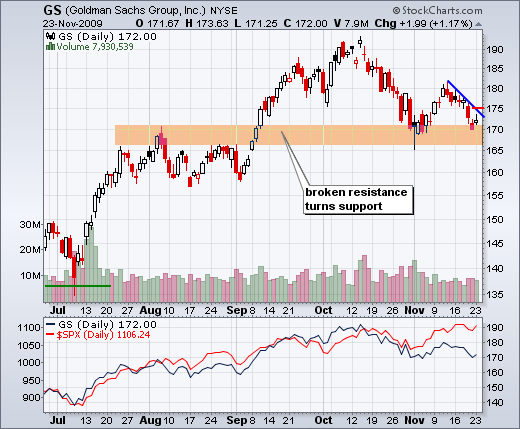
Goldman Sachs (GS) is also an important component for the Financials SPDR, but its weighting (6.24%) is about half that of JP Morgan Chase. GS is also showing relative weakness with a decline over the last 6-7 weeks. However, the stock is now trading in a support zone from broken resistance. GS bounced off the 165-170 area in early November and is again testing 170. The two week trend is down though and a break above 175 is needed to reverse this slide.

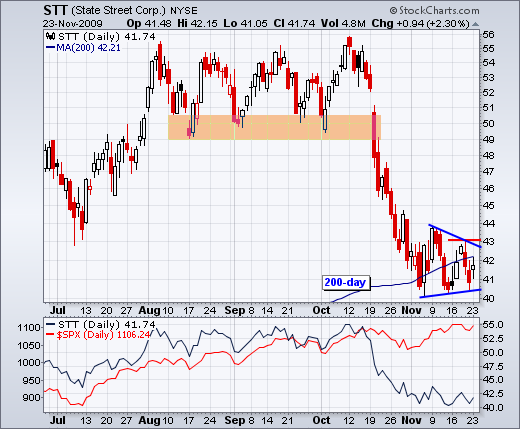
State Street (STT) was hit hard in October and plunged to its 200-day moving average. STT is now finding support around the 200-day SMA as it consolidates around 42. A triangle is taking shape and I will be watching the boundaries for the next signal. A break above 43 would be bullish, while a break below 40 would be bearish. Watch this one closely for clues on the finance sector and the market overall.


About the author:
Arthur Hill, CMT, is the Chief Technical Strategist at TrendInvestorPro.com. Focusing predominantly on US equities and ETFs, his systematic approach of identifying trend, finding signals within the trend, and setting key price levels has made him an esteemed market technician. Arthur has written articles for numerous financial publications including Barrons and Stocks & Commodities Magazine. In addition to his Chartered Market Technician (CMT) designation, he holds an MBA from the Cass Business School at City University in London.
Learn More


