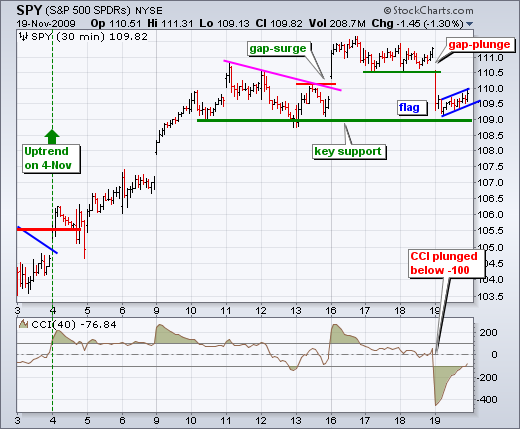
Stocks gapped down and pretty much stayed down on Thursday. After gapping up on Monday, SPY traded flat for three days and then gapped down on Thursday. A little consolidation after Monday's gap is normal, but giving it all back with such a sharp decline is not normal for a mere correction or pullback. SPY staved off a trend reversal by firming at support from last week's lows with a small rising flag. A break below flag support (109.25) would trigger the first bearish signal. As far as a complete short-term trend reversal, I would look for a break below key support at 109. The bottom indicator shows CCI plunging below -100 for the second time in two weeks. Such plunges show intense selling pressure. I am now waiting for confirmation with a support break on the price chart.


