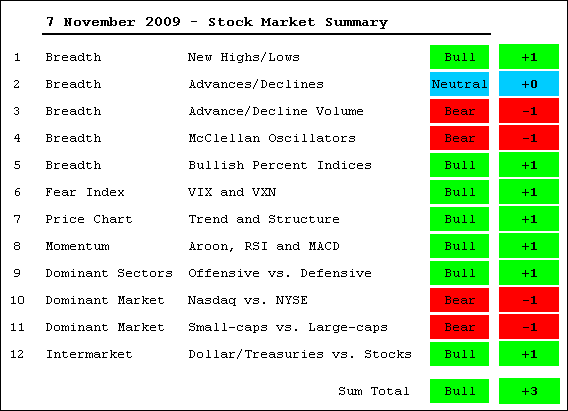
It's the bulls by a nose. After the October decline, the bulk of the medium-term evidence was teetering on the edge of turning bearish. However, a sizable bounce this week brought the bulls back from the brink. As a result, the bulk of the evidence remains bullish. Many indicators are still quite close to turning bearish, but I will call it as I currently see it. It ain't bearish until its bearish. The commentary below runs through all the indicators with an outline of my stance. You can view all the breadth charts by clicking here. Enjoy the weekend!
NYSE AD Line: Bullish. The uptrend remains as the indicator recorded a new high in October and remains above its early October low.
NYSE AD Volume Line: Bearish. Indicator formed a bearish divergence with a lower high in October and broke below its early October low.
NYSE Net New Highs: Bullish. Cumulative Net New Highs line remains above its 10-day SMA as new 52-week highs outpace new 52-week lows.
NYSE McClellan Oscillator: Bearish. Indicator plunged below -50 in early October and again in early November.
Nasdaq AD Line: Bearish. Indicator formed a bearish divergence with a lower high in October and broke below its early October low.
Nasdaq AD Volume Line: Bearish. Indicator broke below its early October low to reverse the uptrend that had been in place since the early April breakout.
Nasdaq Net New Highs: Bullish: Cumulative Net New Highs line has been flat since late October, but edged back above its 10-day SMA this week.
Nasdaq McClellan Oscillator: Bearish. Indicator plunged below -50 on August 17th and has since plunged below -50 three more times (early Sep, early Oct and late Oct).
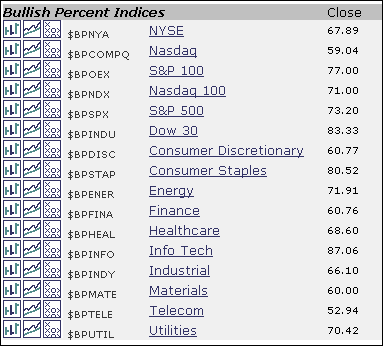
Bullish Percent Indices: Bullish. All remain above 50%, which means that more than 50% of the stocks in each index are on Point & Figure buy signals. Notice that the Nasdaq bullish percent index is at 59%, the lowest of the major indices.
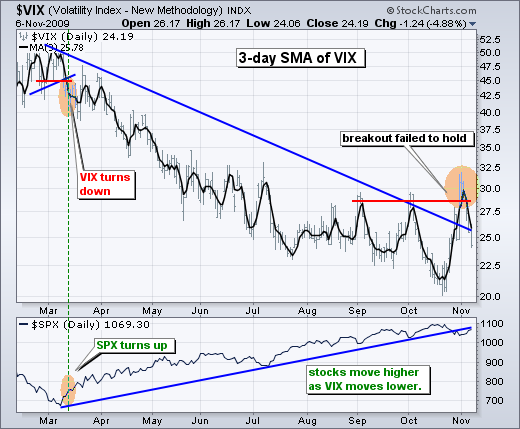
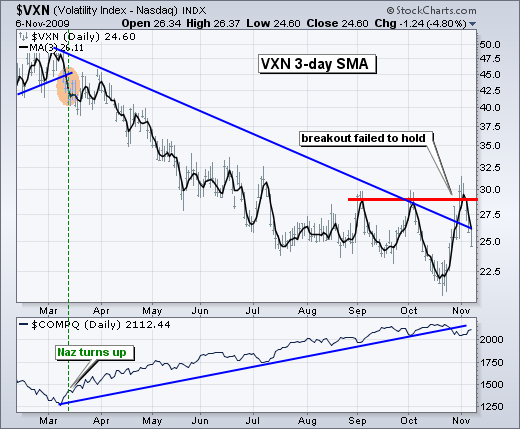
$VIX and $VXN: Bullish. Technically, the S&P 500 Volatility Index ($VIX) and the Nasdaq 100 Volatility Index ($VXN) broke above their Sept-October highs, which is bullish for volatility and negative for the stock market. However, both fell sharply this week and the breakouts did not last long enough. I will hold out before considering these indicators bearish. This week's decline could just be a post-breakout pullback and I will be watching it closely.
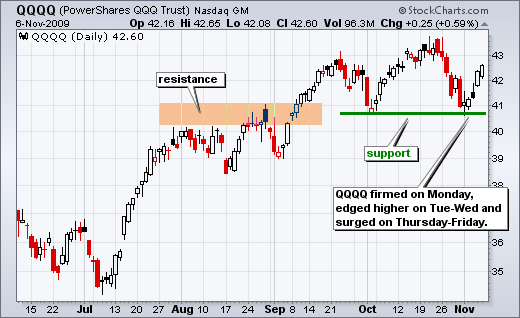
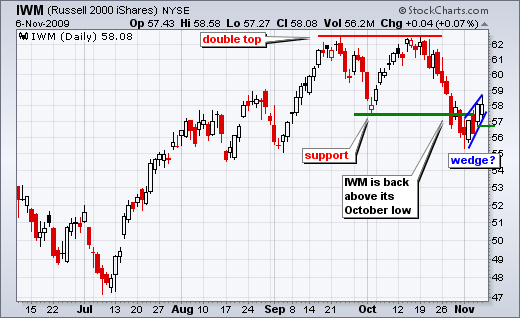
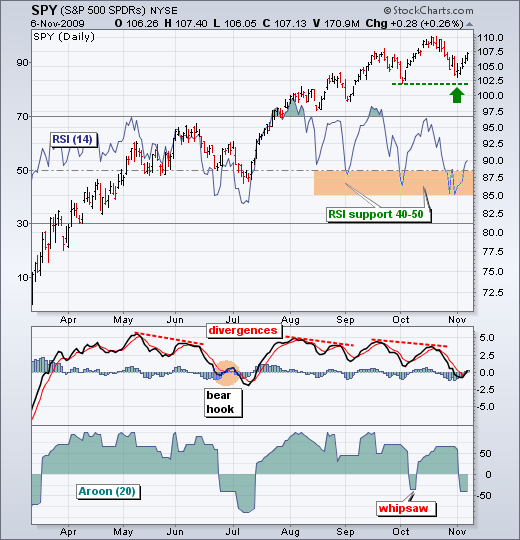
Price Chart: Bullish. The S&P 500 ETF (SPY) held above its October low. The QQQQ bounced off support from the October low. DIA held above its October low. IWM was the only major index ETF to break its October low. With 3 out of 4 holding support, the uptrends remain in place.
Momentum: Bullish. Using SPY as the market proxy, the momentum indicators are still bullish overall, but just barely. RSI held the 40-50 zone and edged back above 50 this week. MACD (5,35,5) moved back above its signal line and into positive territory. However, this might be a bear-hook like that seen in late June. Aroon (20) is bearish after a move below zero.
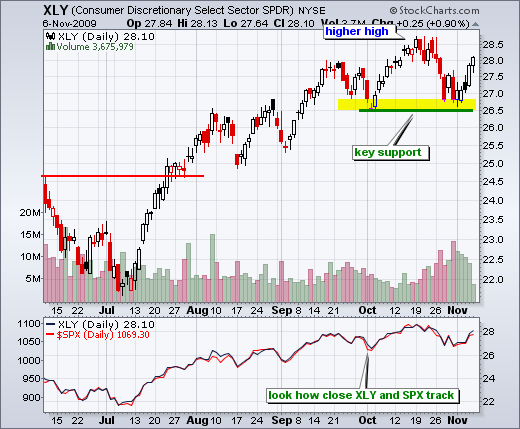
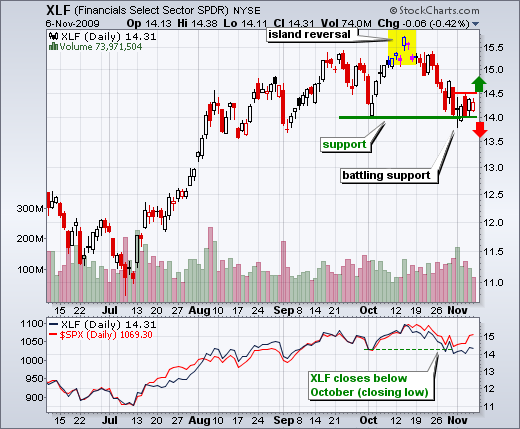
Offensive Sectors: Bullish. As outlined in Art's Charts on Friday, the consumer discretionary, technology and industrials sectors are pulling their weight. All three found support at or above the October low and rebounded this week. Even though it is not the biggest, I view the consumer discretionary as the most important sector because it is the most economically sensitive. The finance sector is dragging a bit though. XLF consolidated with two inside days on Thursday-Friday. Watch 14.5 up and 14 down.
Nasdaq versus NY: Bearish. As seen from the breadth indicators and bullish percent indices, the Nasdaq bore brunt of selling pressure and shows more weakness than the NY Composite.
Small-caps versus Large-caps: Bearish. The Russell 2000 ETF was the only major index ETFs to break its October low and this shows relative weakness.
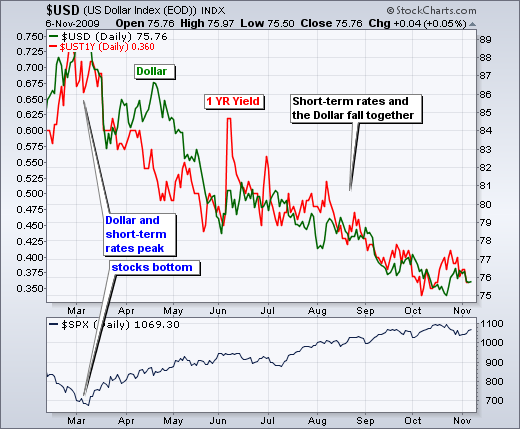
Intermarket: Bullish. The Dollar and short-term rates remain in clear downtrends, which has corresponded with an uptrend in the S&P 500.

