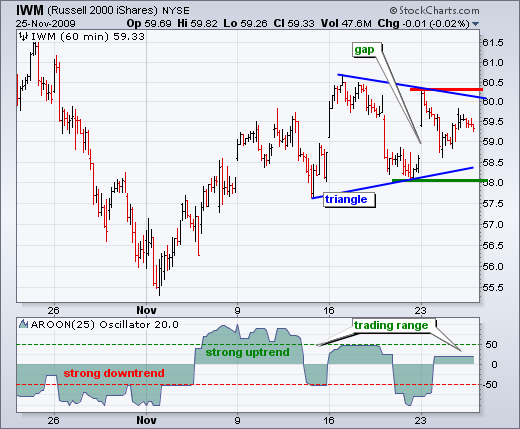
The Russell 2000 ETF (IWM) is stalling with a symmetrical triangle over the last two weeks. Because the prior move was up, there is still a bullish bias overall. However, the ensuing break will determine the next directional signal for IWM. A move above this week's high would signal a continuation higher, but a break below 58 would signal a bearish reversal.


I am using a 60-minute chart to show changes in the Aroon oscillator over the last five weeks. There was a strong downtrend in late October as Aroon remained mostly below -50. A strong uptrend started in early November with the surge above +50. This did not last long as the indicator moved back to -50 in mid November. Since then Aroon has not been above to hold above zero for any length of time. This reflects choppy trading and the symmetrical triangle. Another move below -50 would turn this indicator bearish.

About the author:
Arthur Hill, CMT, is the Chief Technical Strategist at TrendInvestorPro.com. Focusing predominantly on US equities and ETFs, his systematic approach of identifying trend, finding signals within the trend, and setting key price levels has made him an esteemed market technician. Arthur has written articles for numerous financial publications including Barrons and Stocks & Commodities Magazine. In addition to his Chartered Market Technician (CMT) designation, he holds an MBA from the Cass Business School at City University in London.
Learn More


