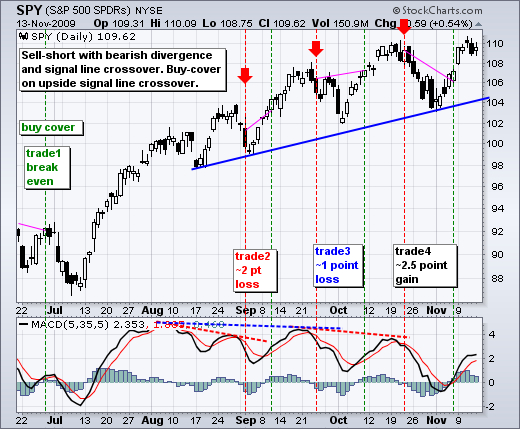
Despite a gain for the week, overall price action for the S&P 500 ETF (SPY) was indecisive last week. SPY surged Monday, stalled for two days, declined sharply on Thursday and stalled on Friday. For the week, the ETF formed a long white candlestick, a long black candlestick and three indecisive candlesticks. The long white candlestick and long black candlestick cancel each other out. Even though Wednesday's move above 110 resulted in a gain, the candlestick shows indecision and looks like a doji. With the black candlestick on Thursday and inside day on Friday, a harami formed over the last two days. These are potentially bearish candlestick reversal patterns that require confirmation. Further weakness below 108.5 would be short-term bearish.

The indicator window shows MACD(5,35,5) with the last four signals. A signal occurs when MACD forms a bearish divergence and moves below its signal line. First, notice that MACD had four bearish divergences followed by signal line crossovers, but we have yet to see a medium-term trend reversal. Bearish divergences are not good medium-term signals. Even though the medium-term trend never reversed, betting on declines with these signals would have resulted in a small loss over the last six months. One trade was breakeven, two were small losses and one was a small gain. MACD could be forming another bearish divergence and the next signal would occur with a move below the signal line. A close at or below 107.8 would push MACD(5,35,5) below its signal line for the fifth signal in six months.
On the 30-minute chart, SPY found support in the 108.5-109 area with a bounce on Friday. This keeps the short-term uptrend alive. Last week's high occurred with Wednesday's gap, which was filled with a decline on Thursday. Overall, SPY has been working its way lower since Wednesday morning. Technically, a break above Friday's high (resistance) would signal a continuation higher. However, I have my doubts on the upside potential of such a signal. Last week's failed gap and the CCI plunge below -100 show weakness. There is also resistance around 110 from the October highs. Even so, we have yet to see an actual trend reversal. Look for a break below support at 108.5 to reverse the short-term uptrend. Upon such a reversal, the first downside target would be the support zone around 103-105.


