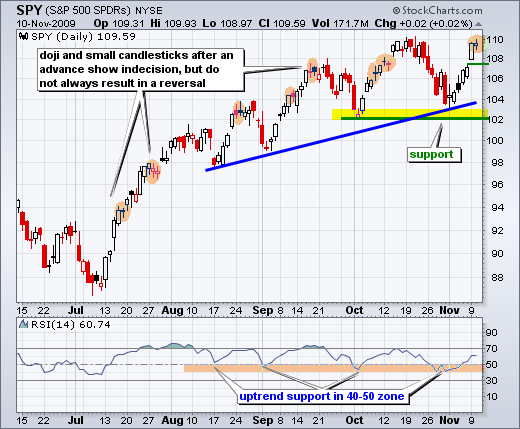
After a 5+ percent surge the prior five days, stocks took a breather on Tuesday as the S&P 500 ETF (SPY) formed a doji on the day. Doji are small candlesticks that look like a plus sign (+). They show little change from open to close and a relatively tight high-low range. Doji after an advance can foreshadow a short-term reversal, but not all the time, as the orange highlighted ovals on the chart show. At this point, I view the doji as a resting point.
An actual short-term reversal requires some significant downside. Namely, I would like to see Monday's surge erased with a move below 107.5. This would only be short-term bearish within a bigger uptrend. The October-November lows mark a support zone arou9nd 102-103 that holds the key to the medium-term uptrend.
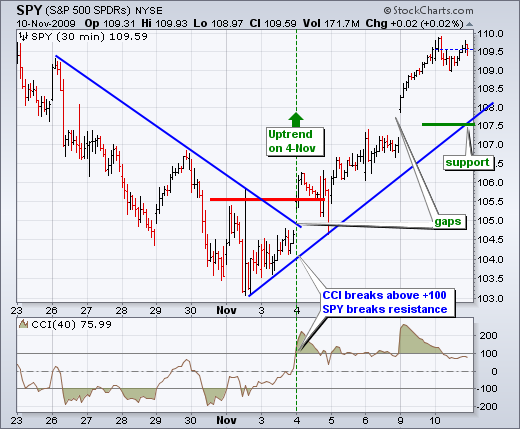
On the 30-minute chart, I have also raised short-term support to 107.5. This level is confirmed by the trendline extending up from the 2-Nov low and the Monday's gap. The majority of Monday's gains need to hold. A move below 107.5 would represent a 2+ percent decline from yesterday's high and erase almost all of Monday's gain. The inability to hold would weaken the bullish case significantly. I would also look for CCI to move below -100 for confirmation. Therefore, two things are required to reverse this uptrend: SPY below 107.5 and CCI below -100. Until such a reversal, expect the uptrend to continue and prices to work their way higher.


