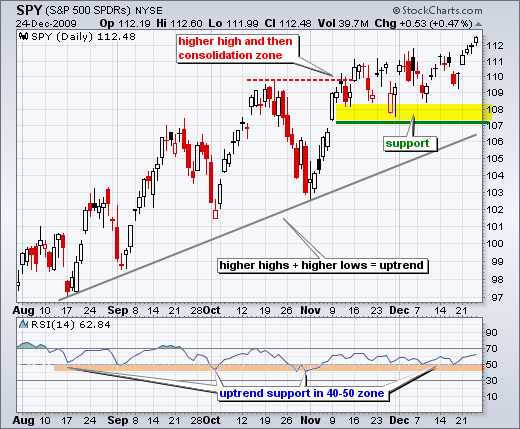
Stocks moved higher with a classic Santa Claus rally last week and the bulls remain in control. Techs and small-caps led the rally as QQQQ and IWM advanced around 5% in the last five trading days. Though not as strong, the S&P 500 ETF (SPY) advanced over 2% in five days and closed at its highest level of the year on Christmas eve. Needless to say, there is nothing but uptrend visible on the daily chart. After forging a higher high in early November, SPY consolidated with a choppy trading range around 110. SPY held the majority of its gains and then broke range resistance with last week's surge above 112. The ability to hold around 110 reflected continued buying pressure. A new 52-week high affirms the underlying uptrend. Support remains in the 107-108 area.


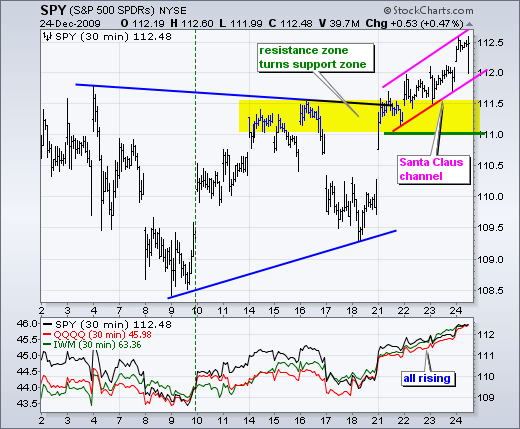
On the 30-minute chart, SPY broke resistance around 111-111.5 and then channeled higher. This is the so-called Santa Claus channel. We can debate the sustainability of this rally, but there is no debating the rally or the higher high. Buying pressure is simply stronger than selling pressure right now. A continuation of the uptrend is expected until selling pressure exceeds buying pressure. The broken resistance zone around 111-111.5 turns into the first support zone to watch on a pullback.


About the author:
Arthur Hill, CMT, is the Chief Technical Strategist at TrendInvestorPro.com. Focusing predominantly on US equities and ETFs, his systematic approach of identifying trend, finding signals within the trend, and setting key price levels has made him an esteemed market technician. Arthur has written articles for numerous financial publications including Barrons and Stocks & Commodities Magazine. In addition to his Chartered Market Technician (CMT) designation, he holds an MBA from the Cass Business School at City University in London.
Learn More


