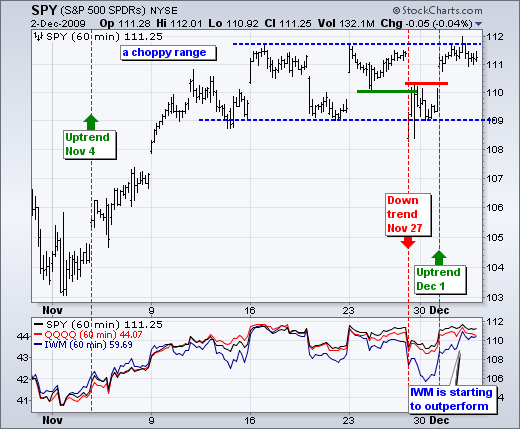
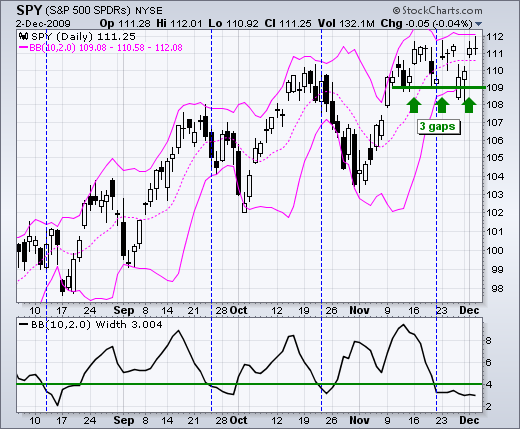
Despite three up gaps in the last three weeks and a volatile range on the 60-minute chart, SPY remains stuck in a trading range with contracting volatility on the daily chart. The chart shows Bollinger Bands (10,2) with Bollinger Band Width in the indicator window. Bollinger Band Width measures the difference between the upper and lower Bollinger Bands. Volatility narrows as the bands contract and expands as the bands widen. The blue dotted lines show when Bollinger Band Width dipped below 4, which has been once per month since August. Keep in mind that Bollinger Band indicators do not provide directional clues. Bollinger Band indicators only show volatility contractions and expansions. A volatility contraction is often followed by a volatility expansion, which happens with a directional move. SPY is currently in a volatility contraction phase as the Bollinger Band Width remains below 4 and the ETF trades range bound. A close below 109 would break this range and argue for a pullback within the bigger uptrend. As long as the last gap holds, the bulls are in firm control and further gains are expected.
On the 60-minute chart, SPY is holding Tuesday's gap and hugging resistance. This is positive. Strong securities hug resistance because buying pressure remains strong. In contrast, weak securities hug support because selling pressure remains strong. There is not much to add on this chart. With the medium-term trend up, seasonality favoring the bulls and performance anxiety driving under-invested fund managers, the odds favor a break above resistance and continuation of the uptrend.

The bottom indicator window shows SPY, QQQQ and IWM. Notice how IWM (small-caps) started outperforming over the last few days. The January effect, in which small-caps outperform the market from mid-December to mid January, appears to be starting early.
Today we have initial claims at 8:30AM and tomorrow is the big employment report, also at 8:30AM ET. Even though a weak job market is negative for the economy, it can be positive for profits and productivity. Fewer workers means lower costs, higher productivity and more profits. It cannot last forever because you can only cut costs so much. Revenues must start increasing at some point.

About the author:
Arthur Hill, CMT, is the Chief Technical Strategist at TrendInvestorPro.com. Focusing predominantly on US equities and ETFs, his systematic approach of identifying trend, finding signals within the trend, and setting key price levels has made him an esteemed market technician. Arthur has written articles for numerous financial publications including Barrons and Stocks & Commodities Magazine. In addition to his Chartered Market Technician (CMT) designation, he holds an MBA from the Cass Business School at City University in London.
Learn More


