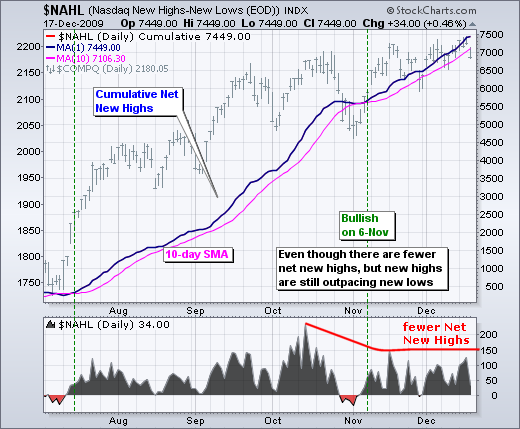
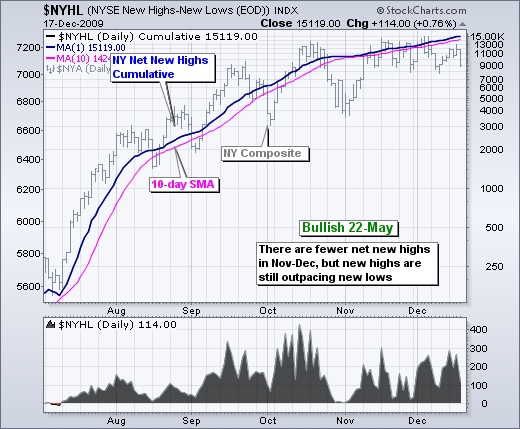
On the bullish side, Net New Highs remain positive for both the Nasdaq and the NYSE. There were fewer Net New Highs in November-December than in October. Even though participation in the advance narrowed in November-December, new 52-week highs are still exceeding new 52-week lows. The bulls still have the edge as the cumulative Net New Highs line rises for both the NYSE and the Nasdaq. At this point, the market is showing less strength, not any real weakness. New 52-week lows must exceed new 52-week highs to show actual weakness.
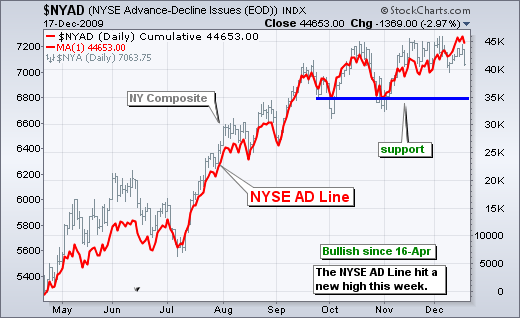
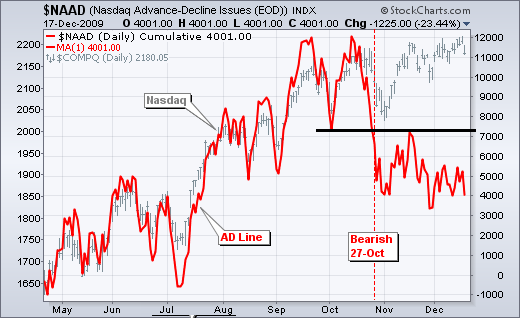
A split has developed within the AD Lines and AD Volume Lines. The NYSE AD Line moved to a new high and remains in bull mode, but the Nasdaq AD Line remains below its October support break and in bear mode. Relative weakness in the Nasdaq AD Line suggests a flight from the riskiest stocks in the Nasdaq. Alternatively, we could turn it around and view this as a flight to higher quality stocks.
Before looking at the AD Volume Lines, it is important to consider what these indicators measure. The AD Line measures cumulative Net Advances (advances less declines). A stock gets +1 for an advance and -1 for a decline, regardless of volume or market capitalization. This means that Microsoft, which has a $262 billion market cap and average volume of 56 million shares, counts the same as Nanometrics, which has a paltry $204 million market cap and average volume of 700,000 shares. All stocks are equal when it comes to the AD Line, but not so with the AD Volume Line. Using the example above, an up day in Microsoft would count for much more volume than an up day in Nanometrics. Therefore, the AD Volume Line favors large-caps and the volume leaders. The AD Line favors small-caps and riskier stocks.
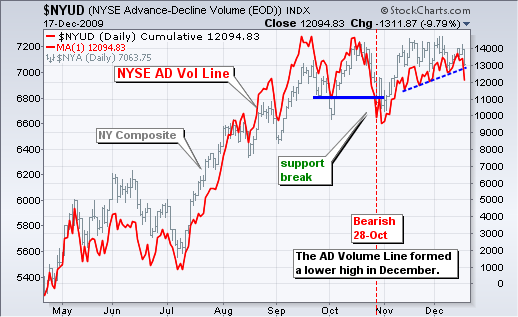
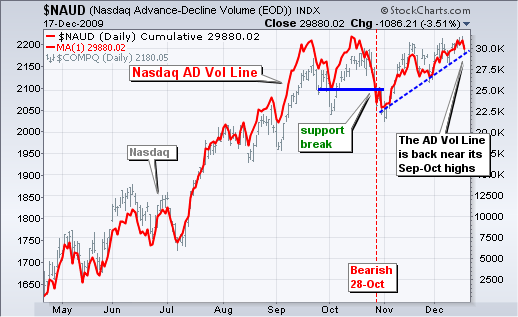
The AD Volume Line for the NYSE fell short of its Sep-Oct highs and declined sharply on Thursday. This can be attributed to weakness in Citigroup and Bank of America. C declined with 2.14 billion shares volume and BAC was down on 268 million shares volume. Here's the crazy thing. According to Yahoo! Finance, Citigroup still has a market capitalization of $76 billion and Bank of America has a market cap of $128 billion. These are not small caps! Turning back to the NYSE AD Volume Line, I view the lower high and sharp decline as bearish for this indicator. The Nasdaq AD Volume Line shows strength because it is trading back near its September-October highs.

About the author:
Arthur Hill, CMT, is the Chief Technical Strategist at TrendInvestorPro.com. Focusing predominantly on US equities and ETFs, his systematic approach of identifying trend, finding signals within the trend, and setting key price levels has made him an esteemed market technician. Arthur has written articles for numerous financial publications including Barrons and Stocks & Commodities Magazine. In addition to his Chartered Market Technician (CMT) designation, he holds an MBA from the Cass Business School at City University in London.
Learn More
