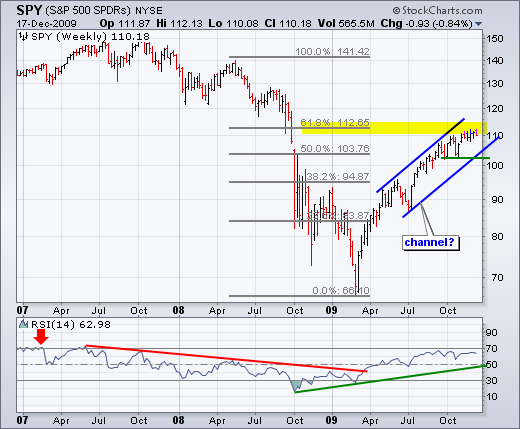
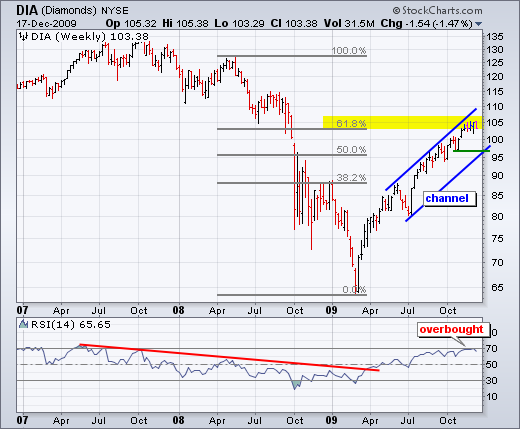
The four major index ETFs remain in clear uptrends on the weekly charts, but all are near potential resistance levels. These charts are grouped in two pairs. First, the S&P 500 ETF (SPY) and the Dow Diamonds (DIA) show similar characteristics. Both have retraced around 62% of the prior decline, which was the monster move from May 2008 to March 2009. In addition, both advanced over 60% from the March low to the December high. While one could argue that the 2 1/2 year trend is still down, the trend since April is clearly up. Even though retracement resistance is at hand, I think the current uptrend carries more weight. At this point, we need to establish a support level that defines the current uptrend.
A downtrend starts with a lower low. Therefore, a break below the early November lows would be the first sign that a downtrend has commenced. The blue lines mark a proposed price channel. Because the July-December advance was so steep, and without much of a pullback, the lower line is based on the upper line. In other words, I drew the upper channel line first and then made the lower channel trendline parallel. This lower low confirms support (SPY at 102 and DIA at 97).


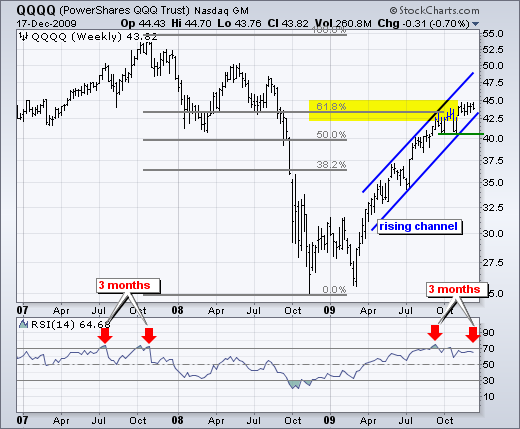
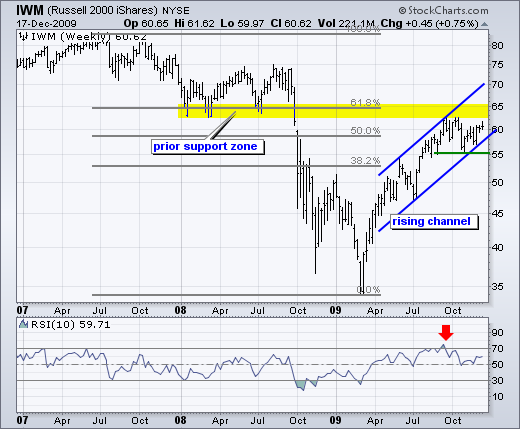
With bigger gains than DIA and SPY, the charts for the Nasdaq 100 ETF (QQQQ) and Russell 2000 ETF (IWM) show different characteristics. First, the March-December advances retraced over 62% of the prior decline (May-08 to March-09). Therefore, I drew my Fibonacci Retracements Tool from the October 2007 high to the March 2009 low. QQQQ even exceeded this 62% retracement and is the strongest of the four. IWM is trading just below this 62% retracement. Even though these areas mark potential resistance, the trend since April remains up and dominates price action. In contrast to DIA and SPY, I was able to draw rising price channels based on the reaction highs and reaction lows. These channel trendlines are parallel. Both remain in uptrends as long as these channels hold. The green lines mark support at the early November low (QQQQ at 40.5 and IWM at 55).


*****************************************************************


