-Net New Highs are fewer, but still positive
-Nasdaq AD Line shows weakness in small techs
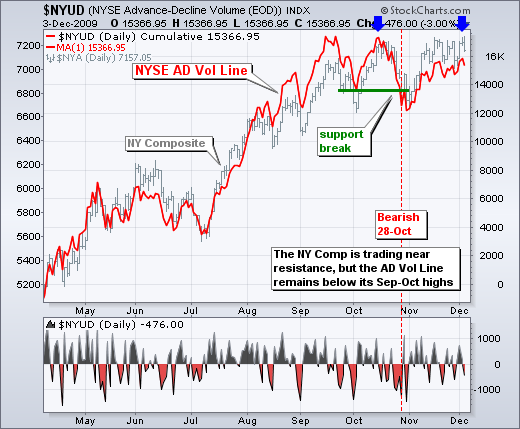
-AD Volume Lines remain below October highs
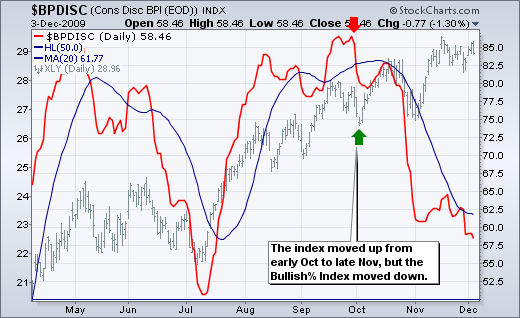
-Consumer discretionary Bullish% Index declines sharply
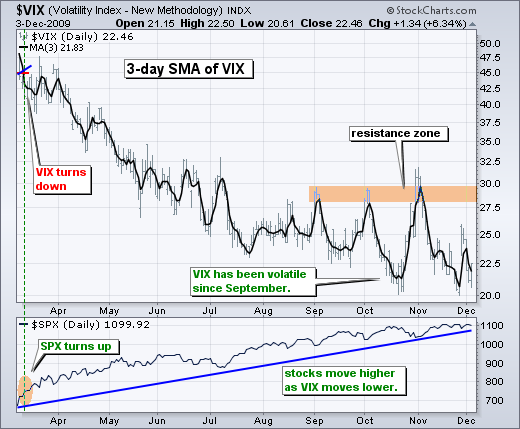
-Volatility remains low
-DIA and SPY consolidate near highs
-Momentum indicators still bullish overall
-Finance sector continues to lag
-Small-caps continue to lag large-caps
-Bond breakout gets a test
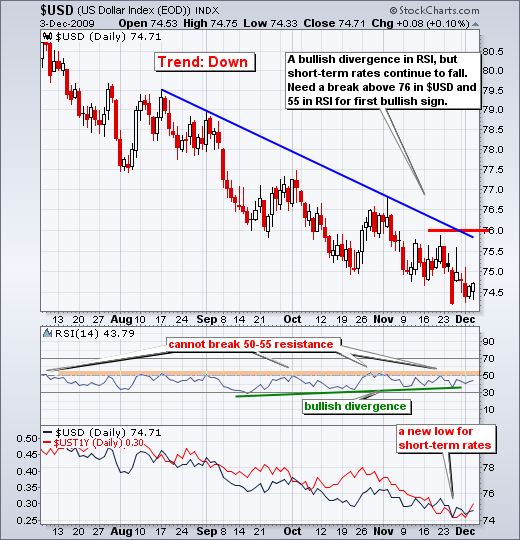
-Dollar and short-term rates remain in downtrend
-Breadth chart page updated (click here)
- Click here for the video page
MT evidence remains bullish
Despite some bearish signs, the bulk of the medium-term evidence remains bullish. On the bearish side, I am seeing weakness in some key breadth indicators and small-caps are lagging large-caps. As noted in Thursday's Market Message, I am also seeing relative weakness in the finance sector, retailers and homebuilders. The latter two are part of the consumer discretionary sector. Consumer discretionary and finance are the two most important sectors for the broad market. I will be watching these two closely in the coming days and weeks.
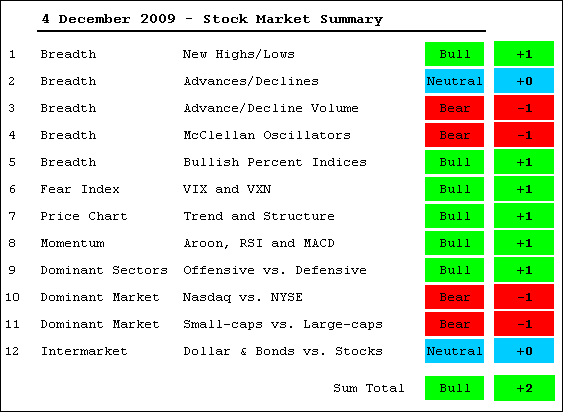
On the bullish side, three of the four major index ETFs recorded new reaction highs in November. Volatility remains low as the VIX hit a new low in November. Momentum may be less strong, but there is clearly more upside mojo than downside mojo. There is a difference between less strong and actual weakness, which we have yet to see. Overall, four indicators are bearish, two are neutral and six are bullish. This relatively mixed result explains choppy trading over the last few weeks. In fact, choppy trading could continue until the evidence makes a clear break one way or the other. The rest of today's report provides a run through the stock market indicators.
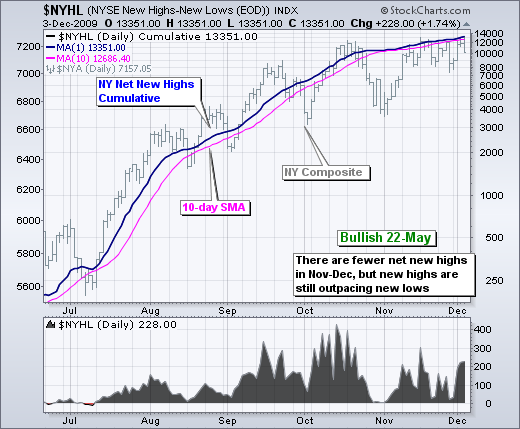
Net New Highs: Bullish. Even though they have flattened out since late October, the cumulative Net New Highs lines for the Nasdaq and NYSE are still rising. This means new 52-week highs continue to outpace new 52-week lows. The bottom window shows daily Net New Highs for the NYSE peaking in October. There were fewer Net New Highs in November and again in December (so far). Participation in the advance is narrowing. This is a concern, but the indicator will not turn bearish until new 52-week lows exceed new 52-week highs.
*****************************************************************
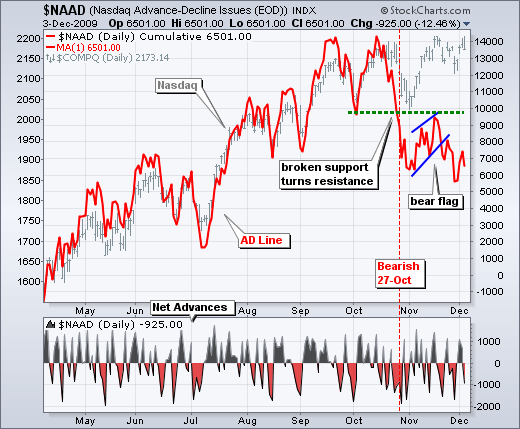
AD Lines: Neutral. The NYSE AD Line is near its October high and in a clear uptrend, but the Nasdaq AD Line remains well below its October high. In fact, the Nasdaq AD Line broke down in late October, formed a lower high in November and broke down again over the last two weeks. The rank-and-file stocks of the Nasdaq are not having a good time right now. This shows a reduced appetite for risk in the market.
*****************************************************************
AD Volume Lines: Bearish. Both AD Volume Lines broke below their early October lows to turn bearish in late October. Both have since rebounded, but remain below their October highs. In contrast, the Nasdaq and NY Composite are both trading near their October highs. A bearish divergence is in the works as these AD Volume Line lag the underlying indices.
*****************************************************************
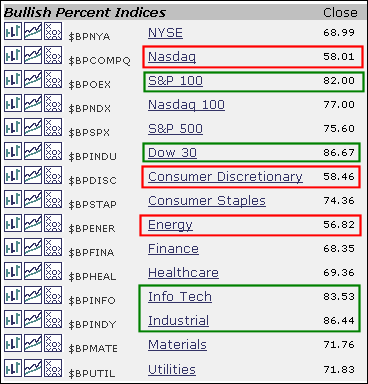
Bullish Percent Indices: Bullish. All of the Bullish Percent Indices are above 50% and in bull mode. Large-caps, as represented by the S&P 100 and Dow, show relative strength. Technology, as represented by the Nasdaq, shows relative weakness. The energy sector also shows relative weakness. I am, however, most concerned with relative weakness in the Consumer Discretionary Bullish% Index ($BPDISC).
The Consumer Discretionary SPDR (XLY) moved up from early October to late November, but the Bullish Percent Index moved down. This is a concern because the consumer discretionary is loaded with retailers, restaurants, homebuilders and manufacturers. These groups derive their revenues from the consumer. Relative weakness in this sector suggests relative weakness in discretionary spending that could ultimately weigh on the economy.
I suspect that the large-caps in this sector SPDR are keeping the ETF strong. McDonalds (7.37%), Walt Disney (6.15%), Home Depot (5.19%), Amazon (5.12%) and Comcast (4.98%) account for over 28%. Of the 70 stocks in XLY, 51 weight less than 1%. As far as the Bullish Percent Index is concerned, the NY Times (.11%) counts as much as McDonalds (7.37%). In other words, all stocks are treated equal, regardless of market cap or chic-ness. This is also the case with the AD Line. The medium and small-caps, which make up the majority, are relatively weak and this is weighing on the Bullish Percent Index.
*****************************************************************
Fear Index: Bullish. The S&P 500 Volatility Index ($VIX) and the Nasdaq 100 Volatility Index ($VXN) are trading near their October lows and remain in clear downtrends. Volatility has turned, well, volatile since September, but the overall trend remains down.
*****************************************************************
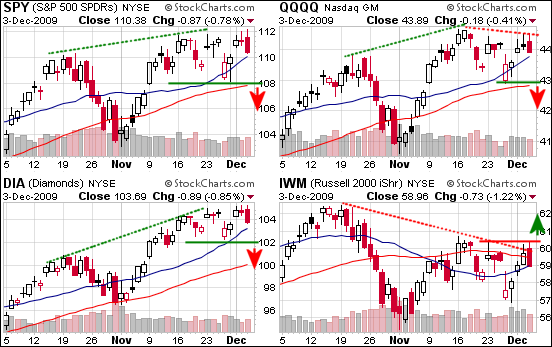
Price chart: Bullish. Three of the four major index ETFs recorded new reaction highs in mid November. Moreover, the Dow Diamonds (DIA) closed at a 2009 closing high on Tuesday and the S&P 500 ETF (SPY) exceeded its November high with an intraday surge above 112 on Thursday. QQQQ fell short of its late November high and shows some relative weakness over the last three weeks. As far as I am concerned, three of the four are in clear uptrends. The late November lows mark the first support zones to watch for signs of material weakness. The Russell 2000 ETF (IWM) remains the weak link with a lower high in November. A break above the late November high is needed to put IWM back in bullish hands.
*****************************************************************
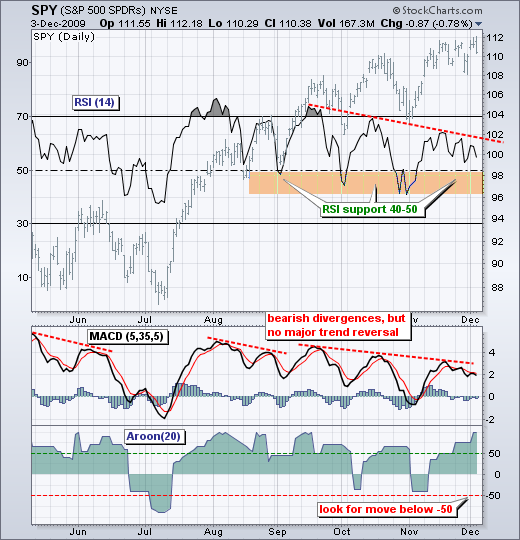
Momentum: Bullish. Key momentum indicators remain bullish for SPY. RSI and MACD(5,35,5) have bearish divergences working, but these have been working since the July high. Even though upside momentum has slowed since July, upside momentum is still stronger than downside momentum. RSI remains above 50 and MACD(5,35,5) remains in positive territory. Aroon(20)moved above just before Thanksgiving and this shows a strong uptrend. A move below -50 is needed to turn this indicator bearish.
*****************************************************************
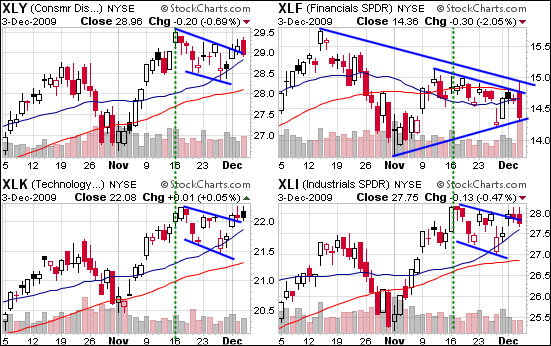
Offensive vs. Defensive Sectors: Bullish. If we compare performance since November 16th (green line), the defensive sectors are doing better than the offensive sectors. However, I do not think three weeks of relative weakness is long enough to turn bearish on this indicator. In addition, I have yet to see actual support breaks that would show weakness. Notice that the Consumer Discretionary SPDR (XLY), Technology SPDR (XLK) and Industrials SPDR (XLI) broke flag resistance with surges on Tuesday. With some weakness on Thursday, these breakouts are under threat. I am most concerned with relative weakness in XLF, which failed to hold early gains on Thursday and formed a triangle over the last two months. Further weakness below last week's low would be bearish for the finance sector.
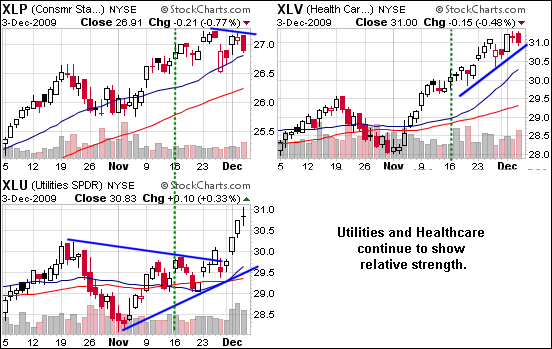
On the defensive end, the Healthcare SPDR (XLV) and the Utilities SPDR (XLU) continue to show relative strength with further gains this week. XLU had an especially strong move this week and even recorded a new 52-week high. The Consumer Staples SPDR (XLP) fell short of its late November high and was the weakest of the three.
*****************************************************************
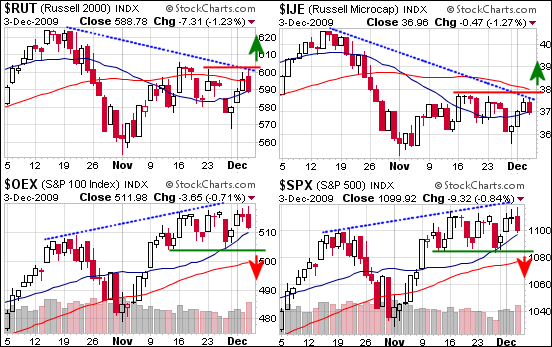
Small-caps vs. Large-caps: Bearish. The Russell 2000 ($RUT) and the Russell Microcap Index ($IJE) continue to lag the S&P 500 and the S&P 100 ($OEX). The small-cap indices remain well below their October highs while the large-cap indices formed higher highs in November. All four have been consolidating the last four weeks. The red lines mark resistance for the Russell 2000 and Russell Microcap Index. Breakouts would be quite positive for the overall market. Conversely, the green lines mark support for the S&P 500 and the S&P 100. Break downs in these two would be negative for the overall market.
*****************************************************************
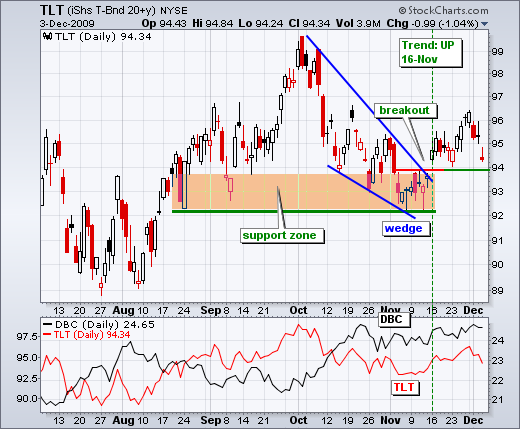
Dollar/Bonds vs. Stocks: Neutral. Despite a sharp pullback over the last three days, the breakout in the 20+ Year Treasury ETF (TLT) is holding and bonds remain in bull mode. A big test is at hand as broken resistance around 94 turns into support. Because interest rates fall when bonds rise, I view the breakout in bonds as bearish for the stock market. Yes, falling interest rates are considered bearish for the stock market. Falling rates signal weakness in the economy and/or fragility in the financial system, both of which are negative for stocks.
While bonds are bullish, the US Dollar Index ($USD) remains bearish. Strength in the stock market has coincided with weakness in the Dollar since March. I will respect this relationship until it changes. $USD is currently trading near its November low and in a clear downtrend. The greenback firmed on Wed-Thur as short-term rates got an oversold bounce. However, both trends remain down.
