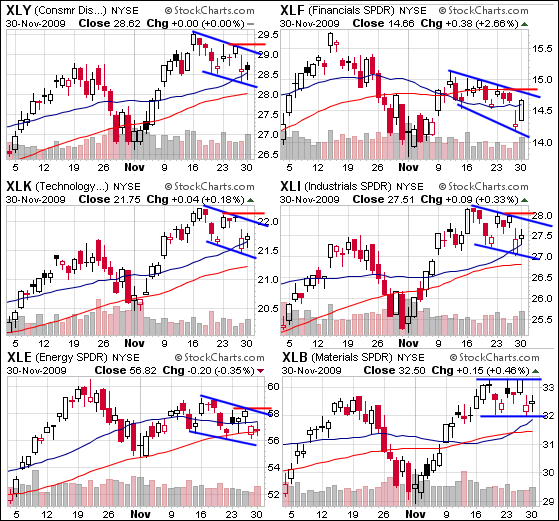
On the CandleGlance charts, the four offensive sectors sport falling consolidations over the last 2-3 weeks. After recording higher highs in mid November, the Consumer Discretionary SPDR (XLY), Technology SPDR (XLK) and Industrials SPDR (XLI) pulled back with falling flags over the last two weeks. Technically, we could call the short-term trend down with these falling flags. The Financials SPDR (XLF) formed a lower high in mid November and also declined the last 2-3 weeks. Each chart shows key resistance in red. A move above resistance would fill Friday's gap and reverse the 2-3 week slide.

The last two charts show the Energy SPDR (XLE) and the Materials SPDR (XLB). XLE has been lagging the broader market with a lower high in November. Nevertheless, XLE sports a falling consolidation over the last two weeks. A break above resistance here would be bullish for XLE. With a flat consolidation over the last two weeks, XLB is holding up the best of the six. The ETF is consolidating near support at 32. Look for a breakout to signal a continuation of the November advance. Charting Note: I copied the chart images to another program to make the annotations.

The last two charts show the Energy SPDR (XLE) and the Materials SPDR (XLB). XLE has been lagging the broader market with a lower high in November. Nevertheless, XLE sports a falling consolidation over the last two weeks. A break above resistance here would be bullish for XLE. With a flat consolidation over the last two weeks, XLB is holding up the best of the six. The ETF is consolidating near support at 32. Look for a breakout to signal a continuation of the November advance. Charting Note: I copied the chart images to another program to make the annotations.

About the author:
Arthur Hill, CMT, is the Chief Technical Strategist at TrendInvestorPro.com. Focusing predominantly on US equities and ETFs, his systematic approach of identifying trend, finding signals within the trend, and setting key price levels has made him an esteemed market technician. Arthur has written articles for numerous financial publications including Barrons and Stocks & Commodities Magazine. In addition to his Chartered Market Technician (CMT) designation, he holds an MBA from the Cass Business School at City University in London.
Learn More


