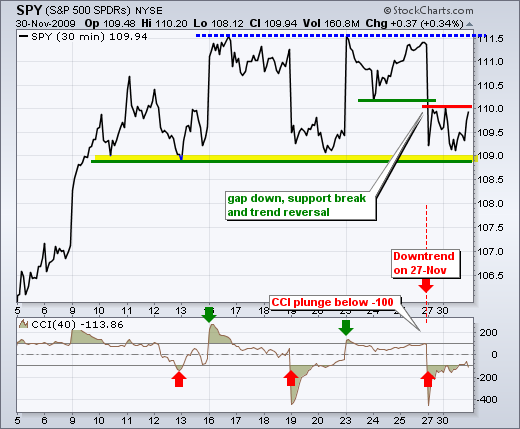
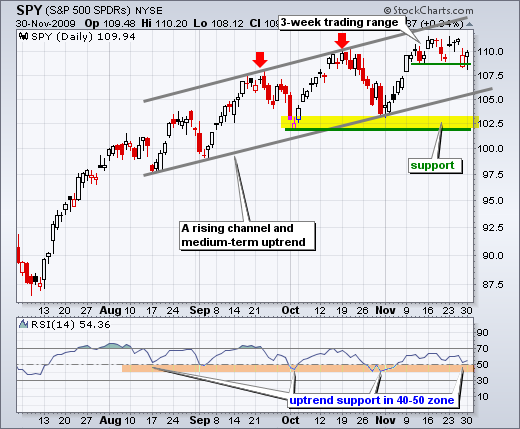
Despite negative ramblings with Dubai and black Friday, the S&P 500 ETF (SPY) is showing resilience on the daily chart. SPY gapped down on Friday, but closed well above its open to form a white candlestick. Even though Monday's candlestick shows an intraday dip to 108.12, I am pretty sure that SPY held above 109 throughout the day. Check out Monday's 1-minute chart to verify. Daily data from The Wall Street Journal, Yahoo! Finance and Quote.com also show an intraday low around 108.12. It is just something that happens to the data-feed sometimes. Turning back to the daily chart, SPY is firming around 109 for the third time in three weeks. Moreover, we must not forget that the medium-term trend is up, seasonality is bullish in November-December and performance anxiety is gripping many an under-invested fund manager. These three alone could keep the market buoyant until early January. Previously, I noted how SPY pulled back after higher highs in September and October (red arrows). The ETF forged a higher high again in November, but has yet to actually pull back or decline. Instead, SPY has pretty much traded flat the last three weeks. The bulls are refusing to buckle and this could give way to a rally.
The 30-minute chart basically captures the trading range of the last three weeks. Notice that I am showing a close-only chart to filter out some of the intraday noise. SPY first established support at 109 on November 10th and has since held this level three times. Even though SPY opened below support on Friday, it recovered within the first 30 minutes to close above 109 at 10AM ET. The close is every 30 minutes on the 30-minute chart. I previously set key support at 110, but I am starting to think this was a mistake. It is dangerous to set short-term support levels too tight when the medium-term trend is up. Therefore, I am going to tighten short-term resistance to 110 on this chart (30 minute close) and 110.5 on the bar/candlestick chart (intraday move). Breakouts would show bullish resilience in the face of adversity. I would then expect a move to resistance at 111.5 and eventually a breakout.


About the author:
Arthur Hill, CMT, is the Chief Technical Strategist at TrendInvestorPro.com. Focusing predominantly on US equities and ETFs, his systematic approach of identifying trend, finding signals within the trend, and setting key price levels has made him an esteemed market technician. Arthur has written articles for numerous financial publications including Barrons and Stocks & Commodities Magazine. In addition to his Chartered Market Technician (CMT) designation, he holds an MBA from the Cass Business School at City University in London.
Learn More


