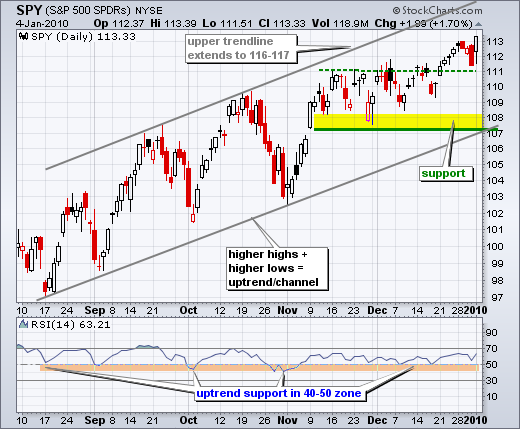
With another new 52-week high, SPY affirmed the underlying uptrend. The ETF broke resistance around 111 in late December and this breakout held the first day of 2010. A rising price channel has taken shape over the last five months. I am using the upper trendline extension for an upside target around 116-117 for this breakout move. With a close at 113.33, SPY is in the upper half of the channel, which means it is closer to its target than support. I am leaving support at 107 and will consider the daily chart-trend bullish as long as this support level holds.


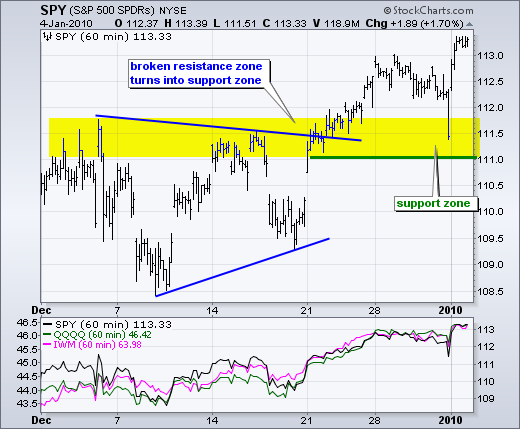
On the 60-minute chart, SPY broke resistance around 111-111.5 and broken resistance turned into support. Despite a sharp decline in the final hour of trading for 2009, SPY held this support zone with a sharp advance the first day of 2010. This bounce reinforces support at 111. Failure to hold the New Year's surge would be short-term bearish. I am tempted to raise key support to 112, but will hold off for now and give the bulls some room to breathe.


About the author:
Arthur Hill, CMT, is the Chief Technical Strategist at TrendInvestorPro.com. Focusing predominantly on US equities and ETFs, his systematic approach of identifying trend, finding signals within the trend, and setting key price levels has made him an esteemed market technician. Arthur has written articles for numerous financial publications including Barrons and Stocks & Commodities Magazine. In addition to his Chartered Market Technician (CMT) designation, he holds an MBA from the Cass Business School at City University in London.
Learn More


