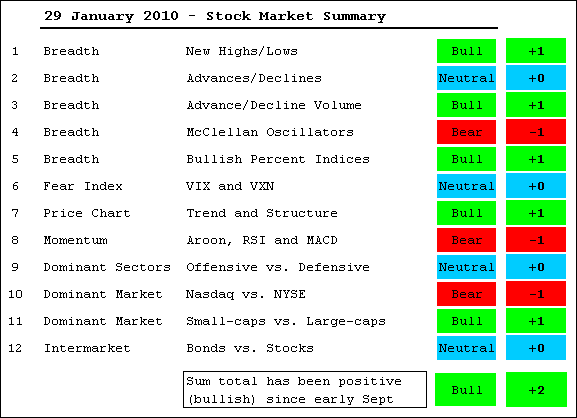
With a sharp decline over the last two weeks, it is hardly surprising that the bullish evidence weakened considerably since early January. Three indicators are considered bearish. The McClellan Oscillators both plunged below -50 to signal a sharp thrust in selling pressure. Momentum is bearish as MACD for SPY moved into negative territory and RSI broke below 40. Offensive sectors are leading lower as techs bore the brunt of recent selling pressure and the Nasdaq is lagging the NYSE. Even with these negatives, four indicators are still sitting on the fence and five remain bullish. The AD Lines are split. Even with the big surge the last two weeks, the volatility indices are trading near resistance levels. Interest rates fell in January, but the 10-Year Treasury Yield ($TNX) is nearing support and may be poised to bounce. Mr Market is nearing the moment-of-truth that distinguishes a mere pullback from a full-fledged correction. So far, this is a pullback similar to the one seen in October. Another serious down week and these indicators will most likely flip in favor of the bears. As it now stands, support levels are holding for the major index ETFs, all the Bullish Percent Indices are above 50% and Net New Highs remain positive. Keep in mind that this table is not designed to predict reversals. Instead, it is designed to identify the main trend and follow until proven otherwise. As such, it will turn bearish after an actual top and bullish after an actual bottom. Those looking to pick bottoms and tops should look elsewhere. These are my personal interpretations of the indicators. 


