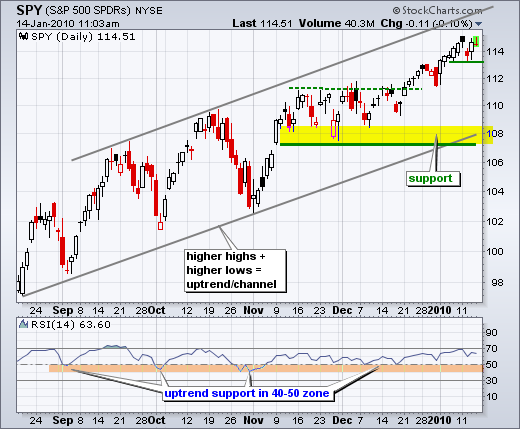
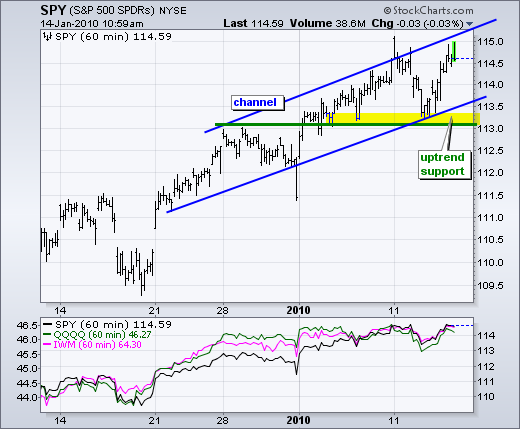
Both the daily and 60-minute charts show SPY within rising channels. The daily chart captures the bigger uptrend, while the 60-minute chart captures the short-term uptrend. After an advance from 109 to 115 in 5-6 weeks, the ETF is short-term overbought and ripe for a pullback or consolidation. A breakdown on the 60-minute chart would provide the first signal that some sort of corrective process is beginning.
 The 60-minute chart sports a rising price channel is support at 113. After two bounces off this level and a higher high this week, I decided to raise support from 111 to 113. A move below 113 would break channel support and forge a lower low. This would reverse the current uptrend. Even if a short-term downtrend takes hold, keep in mind that the bigger trend will still be up. This could limit a pullback or make for choppy trading as the short-term bears and medium-term bulls slug it out.


