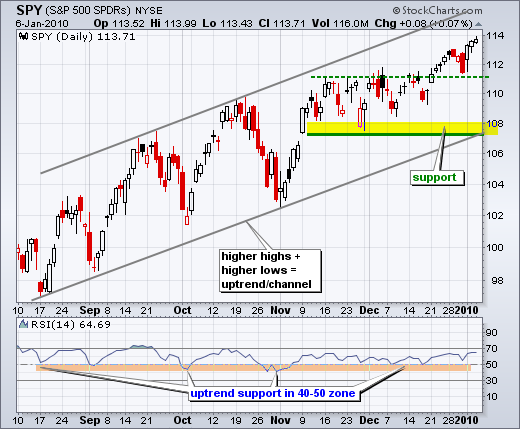
There is no change on the daily or 60-minute charts, both of which are currently bullish. SPY has been up 14 of the last 19 trading days with the ETF moving from ~109 to ~114 over this four week period (up ~4.5% since December 9th). Even though one could make the argument for short-term overbought conditions, there is clearly more buying pressure than selling pressure right now. Overall, a rising price channel is taking shape over the last five months with support around 107-108. With SPY currently in the upper half of this channel, it is closer to potential resistance than support.


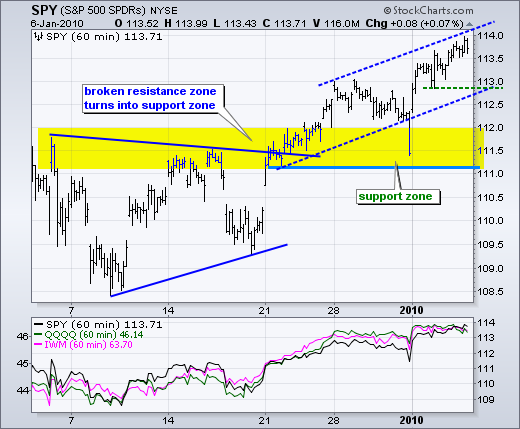
On the 60-minute chart, SPY broke triangle resistance and then worked its way higher the last three weeks. A last hour sell-off pushed the ETF below 112 on New Year's Eve, but SPY bounced back immediately in the New Year. A channel has taken shape with support around 112.7-112.9. This is the first level to watch for signs of weakness. I am not going to get trigger-happy on the bearish side though. The bigger trend remains up and still holds more influence. Don't forget that the employment report is due Friday before the open.


About the author:
Arthur Hill, CMT, is the Chief Technical Strategist at TrendInvestorPro.com. Focusing predominantly on US equities and ETFs, his systematic approach of identifying trend, finding signals within the trend, and setting key price levels has made him an esteemed market technician. Arthur has written articles for numerous financial publications including Barrons and Stocks & Commodities Magazine. In addition to his Chartered Market Technician (CMT) designation, he holds an MBA from the Cass Business School at City University in London.
Learn More


