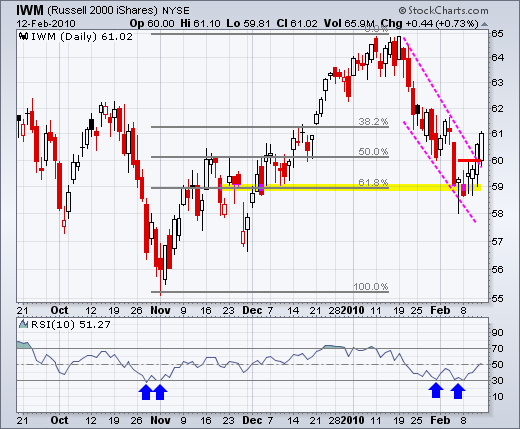
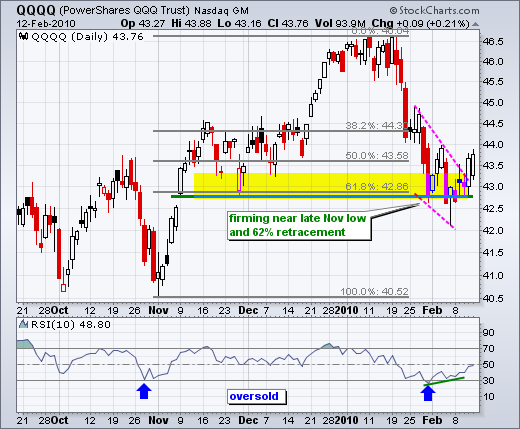
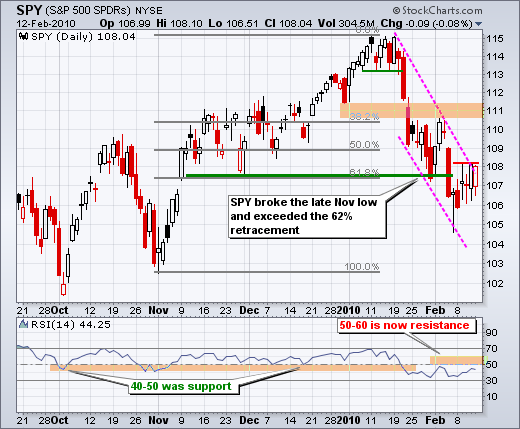
Today I am starting with the Russell 2000 ETF (IWM) and Nasdaq 100 ETF (QQQQ) because both are showing resilience with pretty good advances over the last two days. Both broke above wedge trendlines and finished near the high for the week. It is positive to see small-caps and large-techs showing relative strength. I also pointed out last week that IWM and QQQQ both found support near their 62% retracements and late November lows. They held up better than SPY during the January-February decline. It is possible that small-caps and large-techs are still in a medium-term uptrend, which obviously throws cold water on my medium-term bearish stance in Friday's market summary table. Frankly speaking, we could still go either way here. There are two big picture options here....
A: The January-February pullback could be a deep correction within an ongoing uptrend. B: The January-February decline started a new medium-term downtrend and bounces are to be sold. Either way, the market is sure acting like it wants to bounce from current levels. Despite bad news out of Europe on Thursday and tightening news from China on Friday, stocks closed strong on Thursday and Friday. EU leaders will most likely have something to say regarding Greece on Tuesday or Wednesday and this could be the catalyst for an oversold Euro bounce that could spark an equity bounce. Even if a medium-term downtrend has started, a bounce back towards the mid January support breaks is still possible.


SPY is also trying to bounce, but the ETF did not manage to exceed Tuesday's high and closed near resistance around 108. A break above last week's highs would open the door for at least a bounce that could extend to the 111 area.

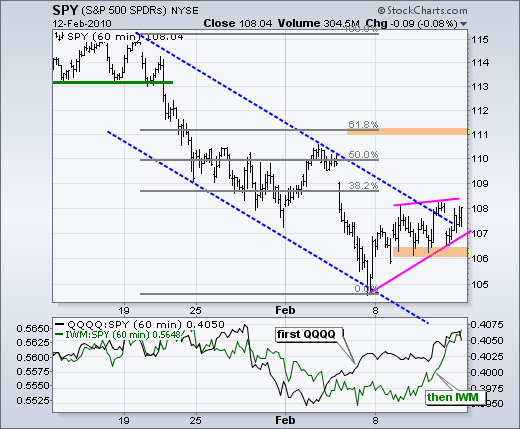
Turning to the 60-minute chart, SPY remains within a slight uptrend over the last four days. This is, however, a slight uptrend within a bigger downtrend. SPY held support around 106 four times last week. This is clearly an important area to watch. A small rising wedge is taking shape a move below 106 would signal a continuation lower.

Looking ahead this week, earnings season remains in swing with some retailers reporting on Tuesday (ANF, FOSL, WFMI, WINN). Homebuilders will be in the spotlight with Housing Starts and Building Permits scheduled for Wednesday before the open. Thursday features, Intial Claims at 8:30AM, Leading Indicators at 10AM and PPI at 8:30AM. The week ends with the Consumer Price Index (CPI) on Friday at 8:30AM. PPI and CPI will give us a hint of inflation, or lack thereof, which could affect the bond market.


