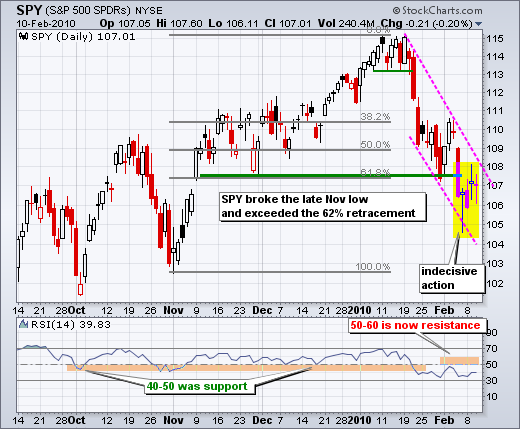
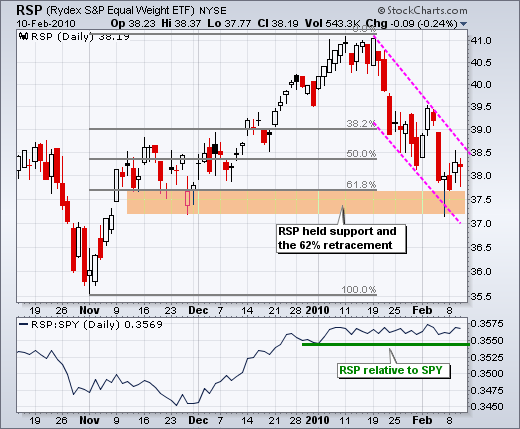
Today I am going to show four daily charts: SPY, RSP, IWM and QQQQ. This is an interesting quartet. SPY broke the late November low and exceeded the 62% retracement. The decline from 115 to 105 was the deepest since March and did enough technical damage to turn medium-term bearish on SPY. In contrast to SPY, the Rydex S&P 500 Equal Weight ETF (RSP) held the late November low and firmed the 62% retracement. These ETFs consist of the same stocks. SPY components are weighted by market capitalization, while RSP components are weighted equally. For RSP, the biggest stock counts just as much as the smallest stock. One could argue that the uptrend in RSP remains in place. Also notice that RSP held up much better than SPY over the last six weeks.


The Nasdaq 100 ETF (QQQQ) and Russell 2000 ETF (IWM) are also firming near their 62% retracements. QQQQ is finding support near the late November low, while IWM is firming well above the late November low. Both QQQQ and IWM held up better than SPY on the last decline. In fact, one could also argue that QQQQ and IWM are still in medium-term uptrends. The decline over the last five weeks was severe, but a 62% retracement is still acceptable.
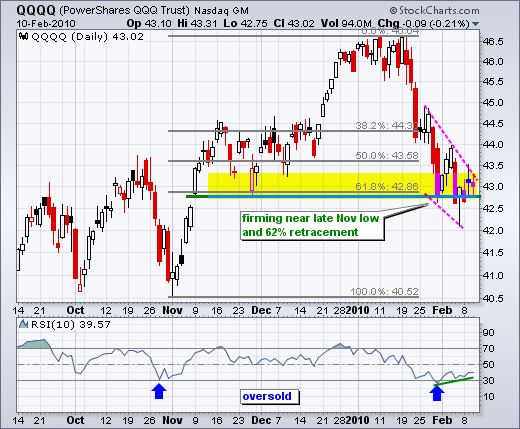
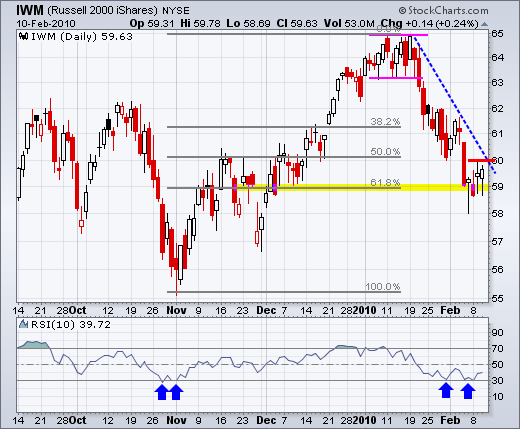
All four charts show falling channels over the last five weeks and indecision over the last four days. If the bull market is still alive and well, then we should see a bottom soon, if not already. Even if a bear market or extended correction is underway, an oversold bounce towards the mid January levels is certainly possible. We have a three day weekend approaching. There may be some buying in anticipation of a Greek bailout by the EU, but we could then see some immediate selling as traders move aside for the three day weekend. The result could be continued indecision until early next week.
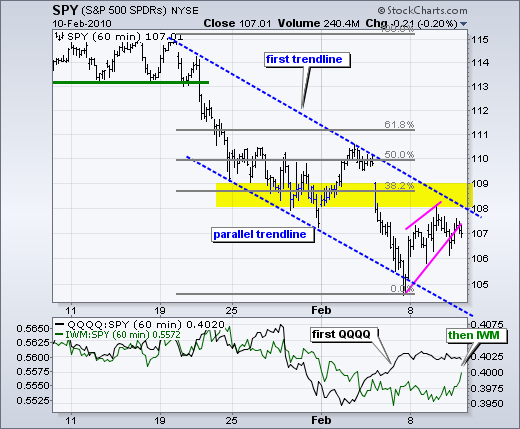
On the 60-minute chart, SPY remains within the falling price channel with resistance in the 108-109 area. The ETF formed a small rising wedge and broke the lower wedge trendline yesterday, but rebounded back above 107 in the afternoon. Choppy action continues to make it a tough call here. The indicator window shows the QQQQ:SPY ratio turning up last week and the IWM:SPY ratio turning up this week. Relative strength in large techs and small-caps is a good sign for the overall market. In fact, these two would likely lead on any rebound.


About the author:
Arthur Hill, CMT, is the Chief Technical Strategist at TrendInvestorPro.com. Focusing predominantly on US equities and ETFs, his systematic approach of identifying trend, finding signals within the trend, and setting key price levels has made him an esteemed market technician. Arthur has written articles for numerous financial publications including Barrons and Stocks & Commodities Magazine. In addition to his Chartered Market Technician (CMT) designation, he holds an MBA from the Cass Business School at City University in London.
Learn More