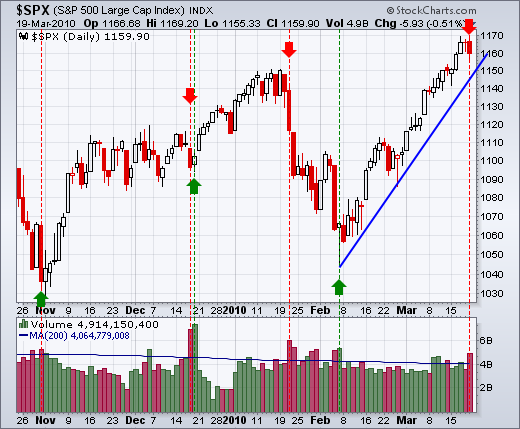
Stocks fell on Friday with the highest volume since early February, which was the scene of the last reversal. High volume sometimes marks a turning point. Stockcharts.com provides volume figures for the S&P 500, Dow Industrials, Nasdaq 100, Nasdaq and NYSE. The first three are the most important because these volume figures are based on operating companies only. Volume for the S&P 500, Dow Industrials and Nasdaq 100 was also the highest since early February. We can blame some of this high volume on quadruple witching (options). Nevertheless, high volume days show expanding volatility that can foreshadow a reversal. With the prior move up, the obvious reversal would be down. Chart XX shows the S&P 500 with high volume reversals in early November, mid January and early February. There were some other high volume days with another witching day in December.

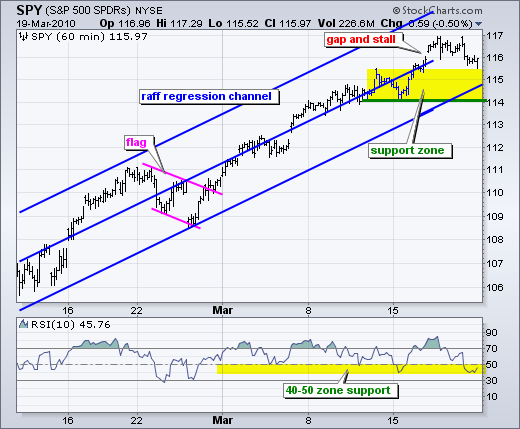
With a strong open and weak close, the S&P 500 ETF (SPY) formed a bearish engulfing on Friday. A lot of stocks and ETFs formed
bearish engulfing and dark cloud patterns on Friday. Today I am showing the channel that was first drawn on Wednesday. Four bearish indications are coming together. In addition to high volume and the bearish engulfing, SPY is trading near channel resistance and overbought. I drew the lower trendline first and then placed the upper trendline parallel from the January high. It projects a move to the 116.5 area, which was reached last week. RSI moved above 70 seven days ago and remains overbought. Top pickers are no doubt licking their chops, but picking tops is a risky game and traders must be prepared for a few failures before getting it right.

On the 60-minute chart, SPY remains within a rising price channel with support at 114. The channel is a Raff Regression Channel , which was drawn when annotating the chart. There is a pecking order when it comes to signals and trend reversals. First, of course, there is simply picking a top. Second, there is a momentum break. This would involve a move below 40 in RSI. Third, there is a trendline break, which is likely to coincide with a momentum break. Fourth, there is a support break or lower low, which signals the actual start of a downtrend.
The economic docket is fairly full this week, starting Tuesday. Although not listed, it appears that there is a Fed governor speaking somewhere every day this week. For instance, Janet Yellen is speaking at 3PM Tuesday at the Los Angeles Town Hall. Never thought of Los Angeles as a "town".
Tue - Mar 23 10:00 Existing Home Sales
Wed - Mar 24 08:30 Durable Orders
Wed - Mar 24 10:00 New Home Sales
Wed - Mar 24 10:30 Crude Inventories
Thu - Mar 25 08:30 Initial Claims
Thu - Mar 25 08:30 Natural Gas Inventories
Fri - Mar 26 08:30 GDP
Fri - Mar 26 09:55 Michigan Sentiment
Charts of Interest: AAPL, FLIR, GOOG, NVLS, ORCL, RIMM
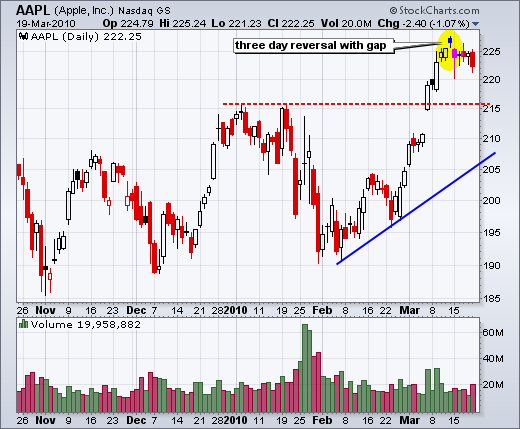
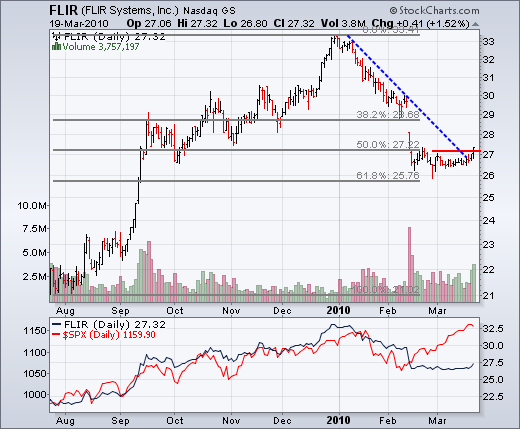
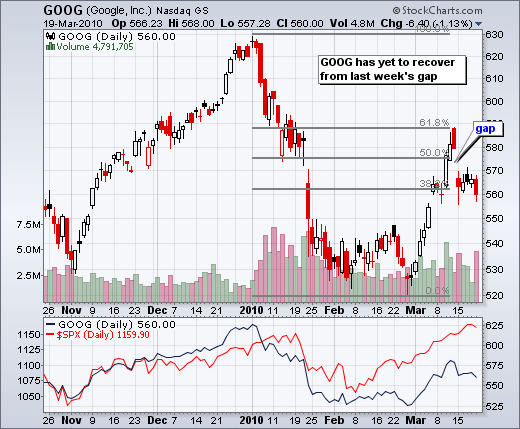
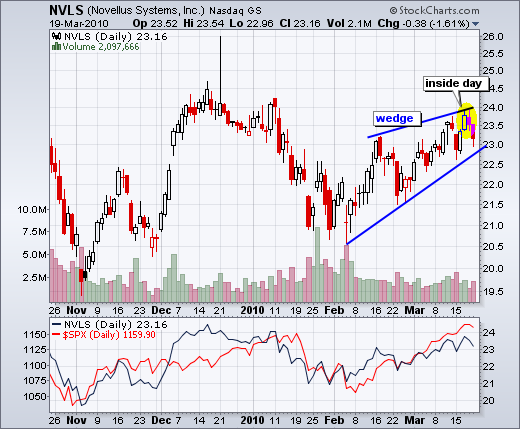
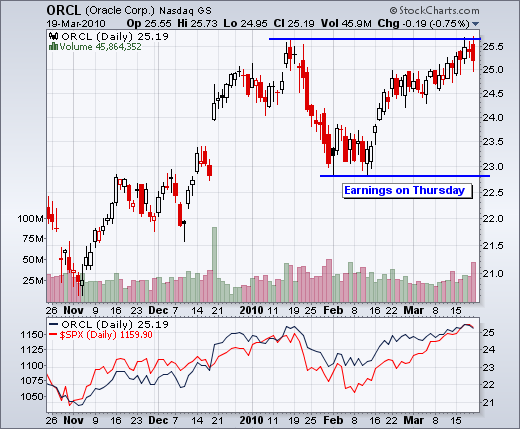
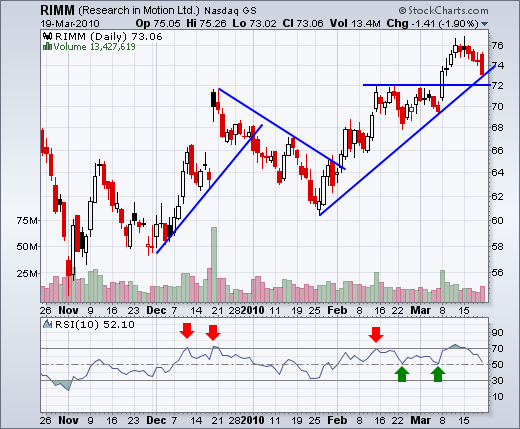
Charts of interest are just that: charts of interest. We all need to think for ourselves when it comes to trading our own accounts. First, it is the only way to really learn. Second, we are the only ones responsible for our decisions. Think of these charts as food for further analysis. Before making a trade, it is important to have a plan. Plan the trade and trade the plan. Among other things, this includes setting a trigger level, a target area and a stop-loss level. It is also important to plan for three possible price movements: advance, decline or sideways. Have a plan for all three scenarios BEFORE making the trade. Consider possible holding times. And finally, look at overall market conditions and sector/industry performance.

On the 60-minute chart, SPY remains within a rising price channel with support at 114. The channel is a Raff Regression Channel , which was drawn when annotating the chart. There is a pecking order when it comes to signals and trend reversals. First, of course, there is simply picking a top. Second, there is a momentum break. This would involve a move below 40 in RSI. Third, there is a trendline break, which is likely to coincide with a momentum break. Fourth, there is a support break or lower low, which signals the actual start of a downtrend.

The economic docket is fairly full this week, starting Tuesday. Although not listed, it appears that there is a Fed governor speaking somewhere every day this week. For instance, Janet Yellen is speaking at 3PM Tuesday at the Los Angeles Town Hall. Never thought of Los Angeles as a "town".
Tue - Mar 23 10:00 Existing Home Sales
Wed - Mar 24 08:30 Durable Orders
Wed - Mar 24 10:00 New Home Sales
Wed - Mar 24 10:30 Crude Inventories
Thu - Mar 25 08:30 Initial Claims
Thu - Mar 25 08:30 Natural Gas Inventories
Fri - Mar 26 08:30 GDP
Fri - Mar 26 09:55 Michigan Sentiment
Charts of Interest: AAPL, FLIR, GOOG, NVLS, ORCL, RIMM


Charts of interest are just that: charts of interest. We all need to think for ourselves when it comes to trading our own accounts. First, it is the only way to really learn. Second, we are the only ones responsible for our decisions. Think of these charts as food for further analysis. Before making a trade, it is important to have a plan. Plan the trade and trade the plan. Among other things, this includes setting a trigger level, a target area and a stop-loss level. It is also important to plan for three possible price movements: advance, decline or sideways. Have a plan for all three scenarios BEFORE making the trade. Consider possible holding times. And finally, look at overall market conditions and sector/industry performance.

About the author:
Arthur Hill, CMT, is the Chief Technical Strategist at TrendInvestorPro.com. Focusing predominantly on US equities and ETFs, his systematic approach of identifying trend, finding signals within the trend, and setting key price levels has made him an esteemed market technician. Arthur has written articles for numerous financial publications including Barrons and Stocks & Commodities Magazine. In addition to his Chartered Market Technician (CMT) designation, he holds an MBA from the Cass Business School at City University in London.
Learn More


