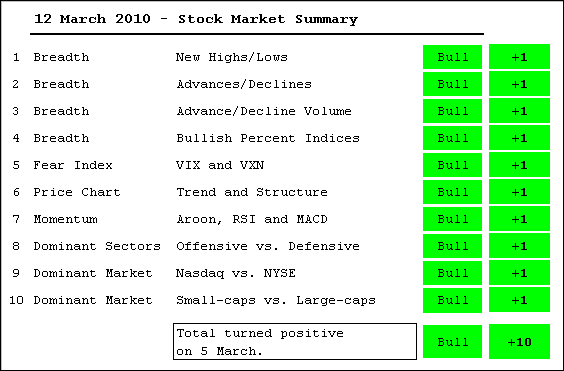
All stock market indicators are in bull mode. Before moving to the details, note that two indicators have been removed. The McClellan Oscillators were removed because they are redundant breadth indicators. The AD Lines represent a purer picture of the advance-decline metrics. The intermarket indicator has been removed because I would like to focus strictly on the stock market. While there is some interaction between stocks, bonds, the Dollar and oil, these relationships change overtime. Let's keep the focus on stocks.
January 15th was the last time all indicators were in bull mode. Hmm, seems to me the market peaked right around then. This table is not designed to pick tops or bottoms. It is the sum of the parts. Right now all parts are bullish. My main concern here is that we are in the midst of a melt up. Prices often accelerate towards the end of a move. They accelerate down towards the end of a decline and accelerate up towards the end of an advance. Right now the advance is in good shape, but we need to monitor conditions closely.
- AD Lines: Bullish. The Nasdaq AD Line surged above its January high and is nearing its Sep-Oct highs. The NYSE AD Line hit a new 52-week high this week and remains in a clear uptrend.
- AD Volume Lines: Bullish. The Nasdaq and NYSE AD Volume Lines hit new 52-week highs this week.
- Net New Highs: Bullish. Nasdaq and NYSE Net New Highs remain a relatively high levels and the Cumulative Net New Highs lines remain above their 10-day SMAs (rising).
- Bullish Percent Indices: Bullish. All major index and sector BPI's are above 50%.
- Fear Index: Bullish. The S&P 500 Volatility Index ($VIX) and Nasdaq 100 Volatility Index ($VXN) tested their January lows this week. In an interesting twist, both stocks and the volatility indices moved higher this week.
- Trend Structure: Bullish. The Russell 2000 ETF, Nasdaq 100 ETF, S&P 400 MidCap ETF and S&P 500 ETF all broke above their January highs. The Dow SPDR remains a hold out.
- SPY Momentum: Bullish. The Aroon Oscillator surged above +50, MACD (5,35,5) moved back into positive territory and RSI surged above 60 in late February. RSI moved above 70 to become short-term overbought for the first time since September.
- Offensive Sector Performance: Bullish. The Consumer Discretionary SPDR (XLY), Financials SPDR (XLF) and Industrials SPDR (XLI) broke above their January highs. The Technology SPDR (XLK) remains below its January high, but QQQQ and the Nasdaq broke their January highs.
- Nasdaq Performance: Bullish. The Nasdaq has been leading the NY Composite since early February.
- Small-caps Performance: Bullish. Small-caps and mid-caps outperformed large-caps since early February.


