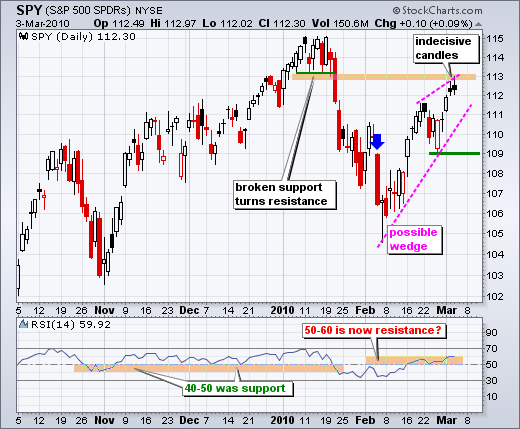
For the second day running, the S&P 500 ETF (SPY) stalled with an indecisive candlestick. Notice the small body (open-close) and the modest upper-lower shadows (intraday high-low). These candlesticks show a stalemate between buyers and sellers. DIA and QQQQ formed similar candlesticks. Even though IWM and MDY hit new 52-week highs intraday, they also finished with indecisive candlesticks (doji). Indecision after an advance can foreshadow a short-term reversal. As far as the medium-term trend is concerned, SPY is running into a possible resistance zone from broken support around 113. The four week advance remains in place, but SPY remains below the January high and a reversal at current levels would forge a lower high. A break below last week's low (109) would fully reverse the upswing and target a decline below the February low. Also notice that RSI is at the top of its resistance zone (50-60). This is a make-or-break point for momentum. For reference, the blue arrow marks Thursday, February 4th, which was the day before last month's employment report. There are also charts of interest after the "continue reading" jump.

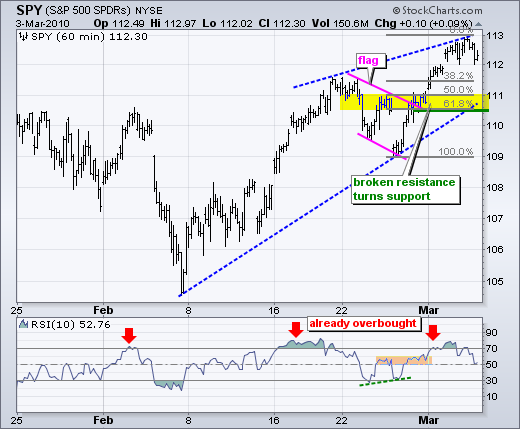
There is no change on the 60-minute chart, which focuses on a shorter timeframe and tighter support level. SPY broke flag resistance and this resistance break turns into a support zone. Also notice that a 50-62% retracement of the 4-day surge would extend to the 110.5-111 area. Support at 110.5 is confirmed with the early February trendline. A break below 110.5 would be the first warning sign. Friday is the employment report, but Mr Market sometimes makes his big move a day or two before the actual report. This happened last month. Note that stocks fell sharply on Thursday, February 4th, and then rebounded with a selling climax on Friday, February 5th. Pre-emptive strikes could occur because we get Initial Claims on today.
Thursday-08:30 Initial Claims
Thursday-08:30 Continuing Claims
Thursday-10:00 Factory Orders
Thursday-10:00 Pending Home Sales
Friday-08:30 Employment Report
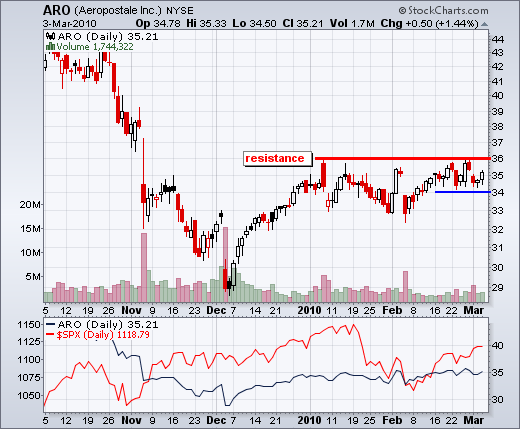
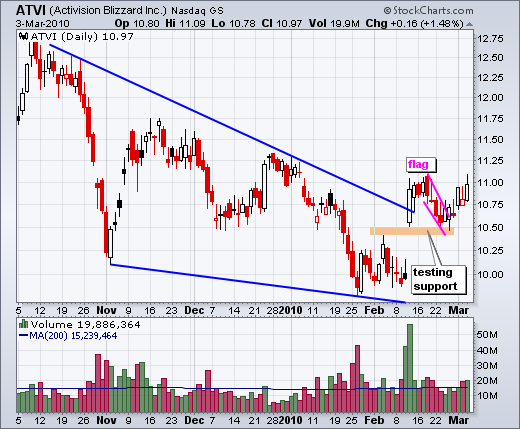
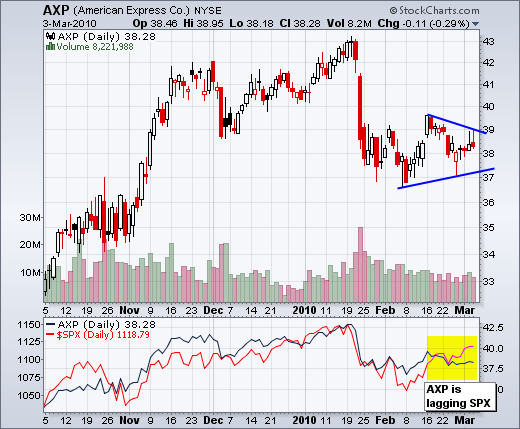
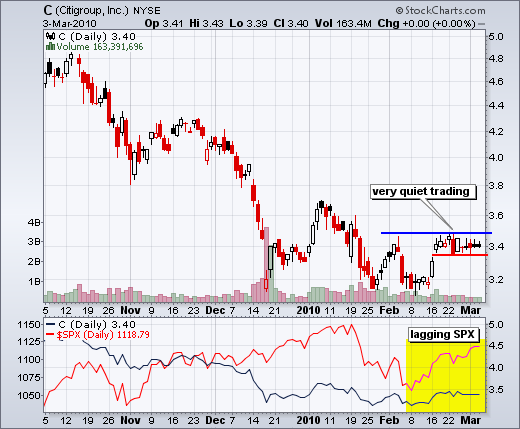
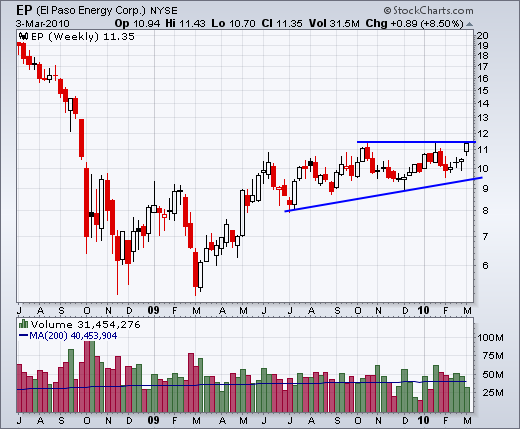
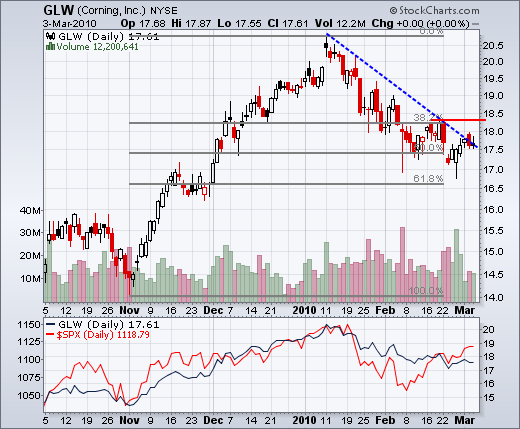
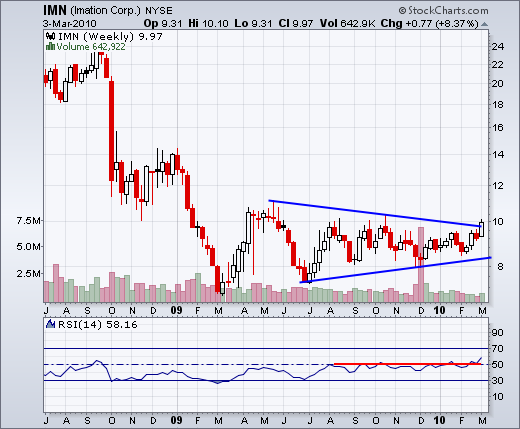
Charts of Interest: ARO, ATVI, AXP, C, EP, GLW, IMN

Thursday-08:30 Initial Claims
Thursday-08:30 Continuing Claims
Thursday-10:00 Factory Orders
Thursday-10:00 Pending Home Sales
Friday-08:30 Employment Report
Charts of Interest: ARO, ATVI, AXP, C, EP, GLW, IMN


About the author:
Arthur Hill, CMT, is the Chief Technical Strategist at TrendInvestorPro.com. Focusing predominantly on US equities and ETFs, his systematic approach of identifying trend, finding signals within the trend, and setting key price levels has made him an esteemed market technician. Arthur has written articles for numerous financial publications including Barrons and Stocks & Commodities Magazine. In addition to his Chartered Market Technician (CMT) designation, he holds an MBA from the Cass Business School at City University in London.
Learn More


