Trading is turning rather volatile, which is just one more sign that a pullback or corrective period may begin soon. SPY first crossed above 116.5 seven days ago. Since this first cross, the ETF has dipped to around 115 and surged above 118. Yesterday's close at 116.65 was in the middle of this range. The old Wall Street adage is: never short a dull market. We could turn that around to: never buy a volatile market - or at least a volatile market that has just had a seven week run.
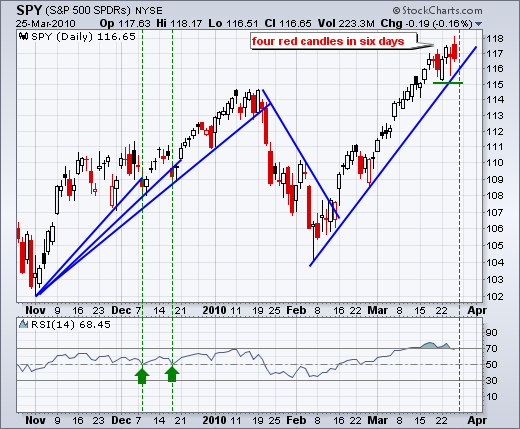

On the 60-minute chart, I tightened the Raff Regression Channel and SPY is trading right at the lower trendline. Notice that this channel version touches last week's reaction high and reaction low. I am still leaving the support zone at 115-116. A break below this level is needed to actually start a downtrend with a lower low. RSI moved above 70 in early trading and finished at 40.21. This sudden swing shows some serious downside momentum with yesterday's decline. Further weakness below 40 would be bearish for momentum.
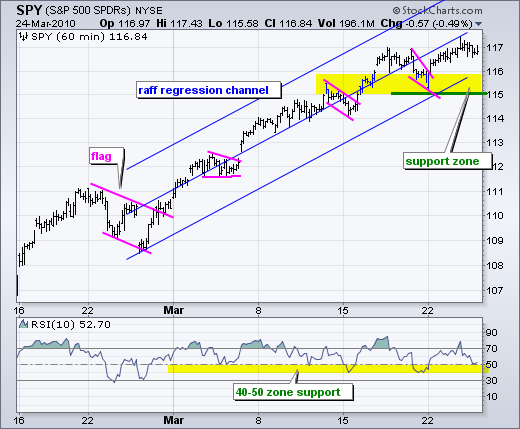
There is a pecking order for signals. The first signal is picking a top after yesterday's failed gap. As noted before, the reward-to-risk ratio is always good when picking a top, but it often takes a few failed attempts before getting a good hit. The second signal is a momentum break when RSI moves below 40. This is likely to coincide with a break below the channel trendline. The third signal is the lower low that signals the start of a downtrend. This signal offers the worst reward-to-risk ratio and it is often better to wait for an oversold bounce that retraces around 50%.
Economic reports due:
Fri - Mar 26 08:30 GDP
Fri - Mar 26 09:55 Michigan Sentiment
Charts of interest:
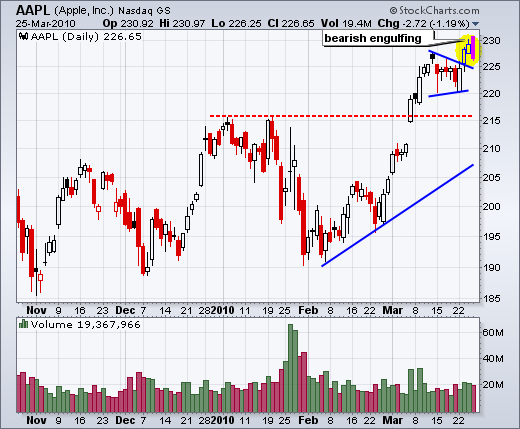
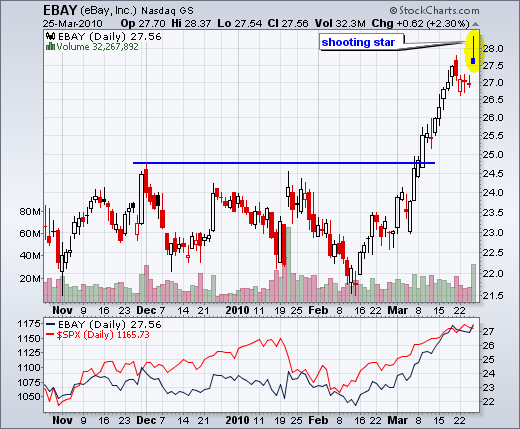
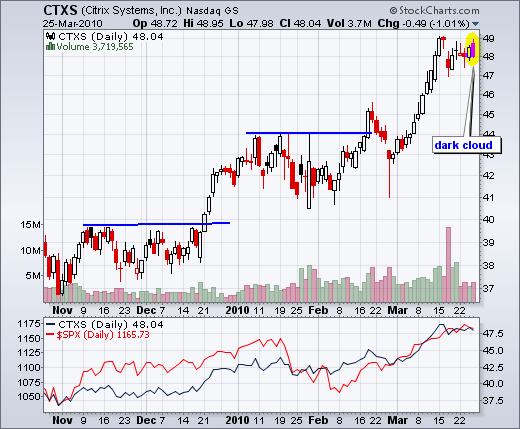
With yesterday's intraday reversal, there were a lot of shooting stars (MSFT, GRMN), bearish engulfings (INTU, BIDU) and dark clouds (NTAP, WSM). These are bearish candlestick reversals that require confirmation. Keep in mind that the bigger trend is up and this is just a short-term indication. The bigger trend still dominates. Candlestick patterns are great when they work, but bearish candlesticks in medium-term uptrends fail more often than they work.
This commentary and charts-of-interest are designed to stimulate thinking. This analysis is not a recommendation to buy, sell, hold or sell short any security (stock ETF or otherwise). We all need to think for ourselves when it comes to trading our own accounts. First, it is the only way to really learn. Second, we are the only ones responsible for our decisions. Think of these charts as food for further analysis. Before making a trade, it is important to have a plan. Plan the trade and trade the plan. Among other things, this includes setting a trigger level, a target area and a stop-loss level. It is also important to plan for three possible price movements: advance, decline or sideways. Have a plan for all three scenarios BEFORE making the trade. Consider possible holding times. And finally, look at overall market conditions and sector/industry performance.

There is a pecking order for signals. The first signal is picking a top after yesterday's failed gap. As noted before, the reward-to-risk ratio is always good when picking a top, but it often takes a few failed attempts before getting a good hit. The second signal is a momentum break when RSI moves below 40. This is likely to coincide with a break below the channel trendline. The third signal is the lower low that signals the start of a downtrend. This signal offers the worst reward-to-risk ratio and it is often better to wait for an oversold bounce that retraces around 50%.
Economic reports due:
Fri - Mar 26 08:30 GDP
Fri - Mar 26 09:55 Michigan Sentiment
Charts of interest:
With yesterday's intraday reversal, there were a lot of shooting stars (MSFT, GRMN), bearish engulfings (INTU, BIDU) and dark clouds (NTAP, WSM). These are bearish candlestick reversals that require confirmation. Keep in mind that the bigger trend is up and this is just a short-term indication. The bigger trend still dominates. Candlestick patterns are great when they work, but bearish candlesticks in medium-term uptrends fail more often than they work.


This commentary and charts-of-interest are designed to stimulate thinking. This analysis is not a recommendation to buy, sell, hold or sell short any security (stock ETF or otherwise). We all need to think for ourselves when it comes to trading our own accounts. First, it is the only way to really learn. Second, we are the only ones responsible for our decisions. Think of these charts as food for further analysis. Before making a trade, it is important to have a plan. Plan the trade and trade the plan. Among other things, this includes setting a trigger level, a target area and a stop-loss level. It is also important to plan for three possible price movements: advance, decline or sideways. Have a plan for all three scenarios BEFORE making the trade. Consider possible holding times. And finally, look at overall market conditions and sector/industry performance.

About the author:
Arthur Hill, CMT, is the Chief Technical Strategist at TrendInvestorPro.com. Focusing predominantly on US equities and ETFs, his systematic approach of identifying trend, finding signals within the trend, and setting key price levels has made him an esteemed market technician. Arthur has written articles for numerous financial publications including Barrons and Stocks & Commodities Magazine. In addition to his Chartered Market Technician (CMT) designation, he holds an MBA from the Cass Business School at City University in London.
Learn More


