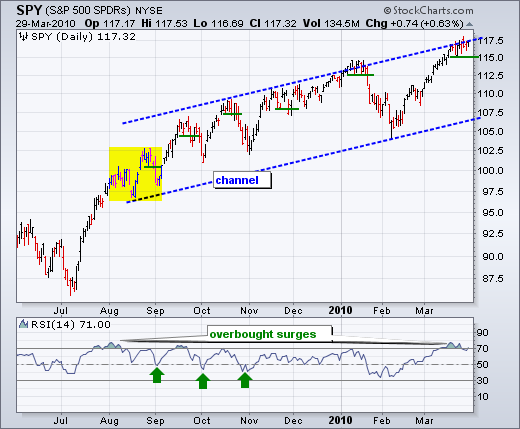
I will start with the chart shown in yesterday's Market Message. There is no new price action so the analysis has not changed. SPY hit the upper trendline of a rising price channel and stalled over the last two weeks. Stalling is not the same as weakness though. It just represents a standoff between buyers and sellers. We have yet to see a decisive decline that could kick off a pullback or correction. The short green lines show prior short-term support levels after an upswing. The January short-term support break provided a good signal, but the other signals were mixed - at best. For playing the upside, traders needed to wait for RSI to move below 50. A subsequent move back above 50 provided some pretty good short-term bullish signals.

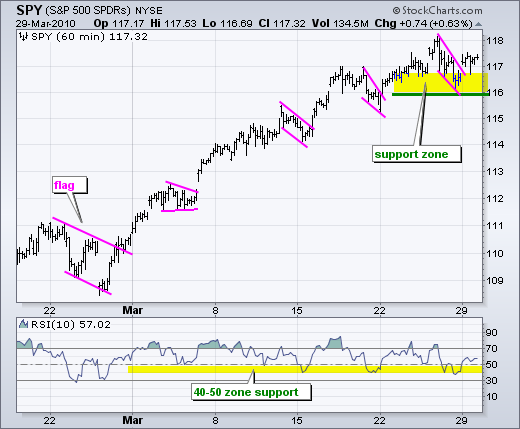
On the 60-minute chart, SPY broke above wedge/flag resistance with a gap up on Monday. The surge held and this breakout is valid until proven other wise. Strong breakouts should hold so a move below 116.5 would show some underlying weakness. I am raising short-term support to 116. It would take a move below this level to actually forge a lower low to start a downtrend. RSI got yet another bounce off the 40-50 zone to keep momentum bullish.
Yesterday I reported that Non-commercials were net long and commercials were net short the S&P 500 e-mini on the Commitment of Traders (COT) reports. There was an error in that statement. This error reminds me of Ronald Reagan's approach towards the Russians in arms negotiations: trust, but verify. Non-commercials (small speculators) were in fact net short as of March 23 and net long as of March 16 and March 9, the prior weeks. Commercials were net short for March 23, March 16 and March 9. Commercials have been net short the last three weeks and non-commercials have been net long two of the last three weeks. Commercials are the professionals or smart money. Non-commercials are viewed as the small speculators or dumb money. The e-mini is used for this sentiment indicator because it is the most active stock futures contract at the CME. More information can be found by Googling for COT and e-mini. Click here for the COT Reports. SPX e-mini can be found under the Chicago Mercantile Exchange.
The economic docket is full this week and we have a short trading week with the Good Friday holiday. The employment report will be reported on Friday, but the stock market will have to wait until Monday for a reaction.
Economic reports due:
Tue - Mar 30 - 09:00 - Case-Shiller Index
Tue - Mar 30 - 10:00 - Consumer Confidence
Wed - Mar 31 - 08:15 - ADP Employment
Wed - Mar 31 - 09:45 - Chicago PMI
Wed - Mar 31 - 10:00 - Factory Orders
Wed - Mar 31 - 10:30 - Crude Inventories
Thu - Apr 01 - 08:30 - Initial Claims
Thu - Apr 01 - 10:00 - ISM Index
Thu - Apr 01 - 14:00 - Auto Sales
Fri - Apr 02 - 08:30 - Nonfarm Payrolls
Fri - Apr 02 - Stock Markets Closed
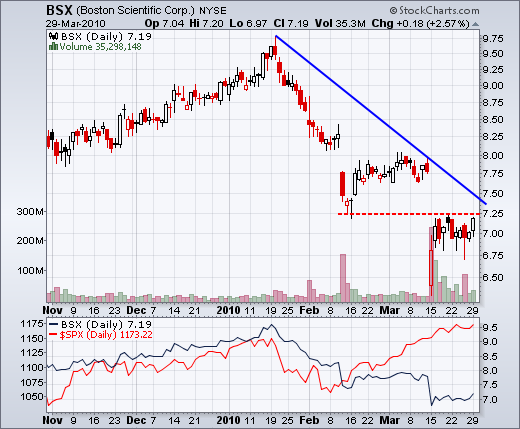
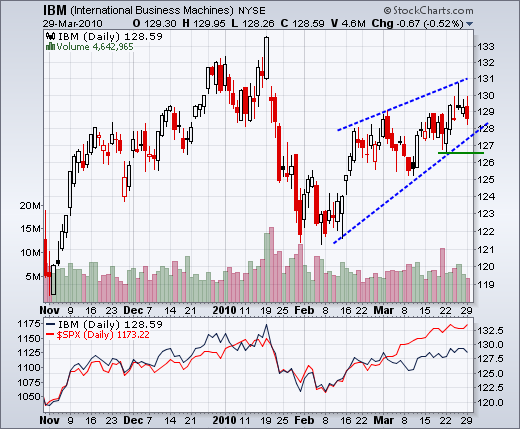
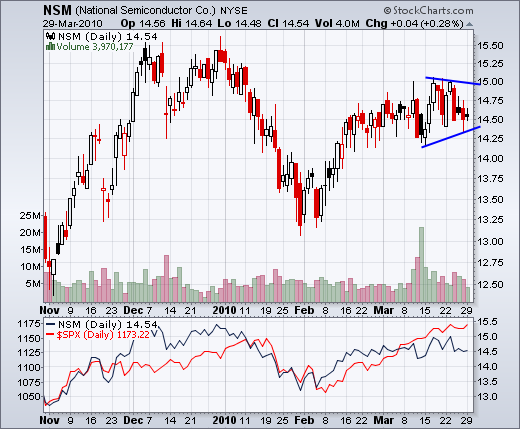
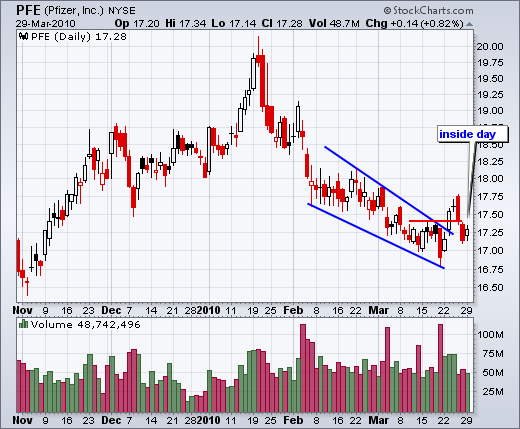
Charts of interest: BSX, IBM, NSM, PFE
This commentary and charts-of-interest are designed to stimulate thinking. This analysis is not a recommendation to buy, sell, hold or sell short any security (stock ETF or otherwise). We all need to think for ourselves when it comes to trading our own accounts. First, it is the only way to really learn. Second, we are the only ones responsible for our decisions. Think of these charts as food for further analysis. Before making a trade, it is important to have a plan. Plan the trade and trade the plan. Among other things, this includes setting a trigger level, a target area and a stop-loss level. It is also important to plan for three possible price movements: advance, decline or sideways. Have a plan for all three scenarios BEFORE making the trade. Consider possible holding times. And finally, look at overall market conditions and sector/industry performance.

Yesterday I reported that Non-commercials were net long and commercials were net short the S&P 500 e-mini on the Commitment of Traders (COT) reports. There was an error in that statement. This error reminds me of Ronald Reagan's approach towards the Russians in arms negotiations: trust, but verify. Non-commercials (small speculators) were in fact net short as of March 23 and net long as of March 16 and March 9, the prior weeks. Commercials were net short for March 23, March 16 and March 9. Commercials have been net short the last three weeks and non-commercials have been net long two of the last three weeks. Commercials are the professionals or smart money. Non-commercials are viewed as the small speculators or dumb money. The e-mini is used for this sentiment indicator because it is the most active stock futures contract at the CME. More information can be found by Googling for COT and e-mini. Click here for the COT Reports. SPX e-mini can be found under the Chicago Mercantile Exchange.
The economic docket is full this week and we have a short trading week with the Good Friday holiday. The employment report will be reported on Friday, but the stock market will have to wait until Monday for a reaction.
Economic reports due:
Tue - Mar 30 - 09:00 - Case-Shiller Index
Tue - Mar 30 - 10:00 - Consumer Confidence
Wed - Mar 31 - 08:15 - ADP Employment
Wed - Mar 31 - 09:45 - Chicago PMI
Wed - Mar 31 - 10:00 - Factory Orders
Wed - Mar 31 - 10:30 - Crude Inventories
Thu - Apr 01 - 08:30 - Initial Claims
Thu - Apr 01 - 10:00 - ISM Index
Thu - Apr 01 - 14:00 - Auto Sales
Fri - Apr 02 - 08:30 - Nonfarm Payrolls
Fri - Apr 02 - Stock Markets Closed
Charts of interest: BSX, IBM, NSM, PFE


This commentary and charts-of-interest are designed to stimulate thinking. This analysis is not a recommendation to buy, sell, hold or sell short any security (stock ETF or otherwise). We all need to think for ourselves when it comes to trading our own accounts. First, it is the only way to really learn. Second, we are the only ones responsible for our decisions. Think of these charts as food for further analysis. Before making a trade, it is important to have a plan. Plan the trade and trade the plan. Among other things, this includes setting a trigger level, a target area and a stop-loss level. It is also important to plan for three possible price movements: advance, decline or sideways. Have a plan for all three scenarios BEFORE making the trade. Consider possible holding times. And finally, look at overall market conditions and sector/industry performance.

About the author:
Arthur Hill, CMT, is the Chief Technical Strategist at TrendInvestorPro.com. Focusing predominantly on US equities and ETFs, his systematic approach of identifying trend, finding signals within the trend, and setting key price levels has made him an esteemed market technician. Arthur has written articles for numerous financial publications including Barrons and Stocks & Commodities Magazine. In addition to his Chartered Market Technician (CMT) designation, he holds an MBA from the Cass Business School at City University in London.
Learn More


