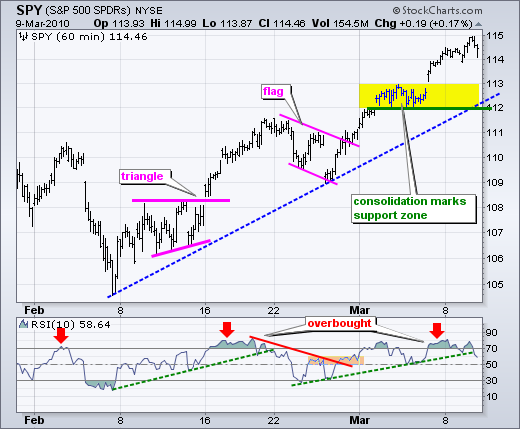
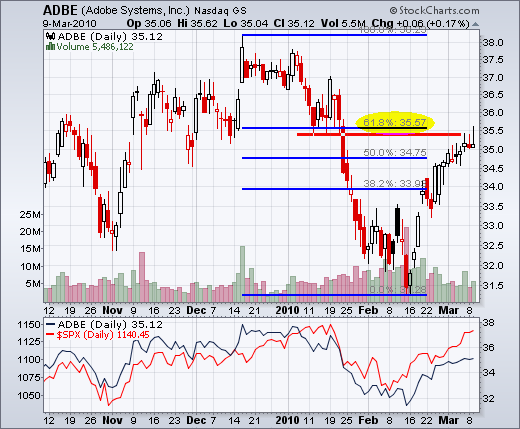
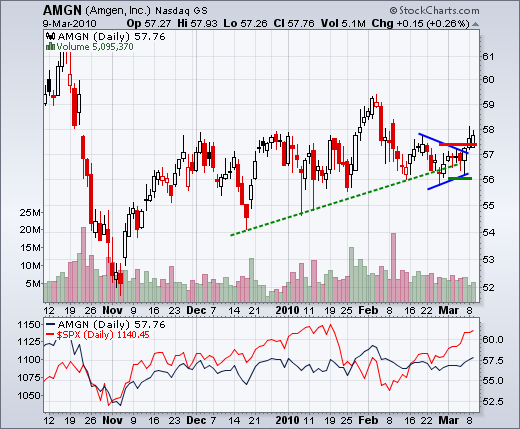
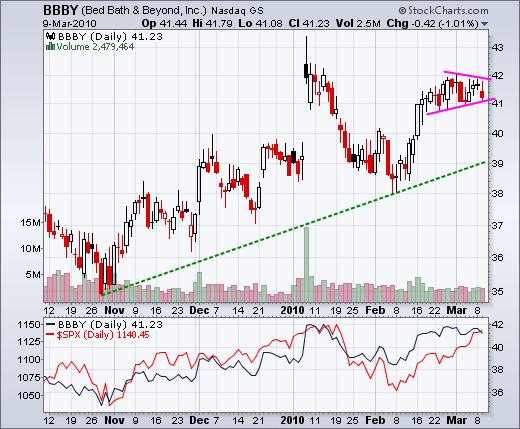
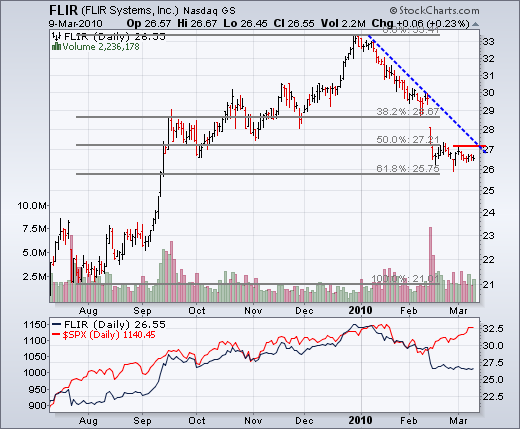
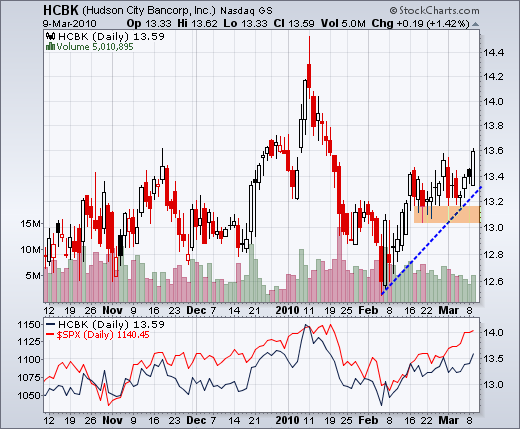
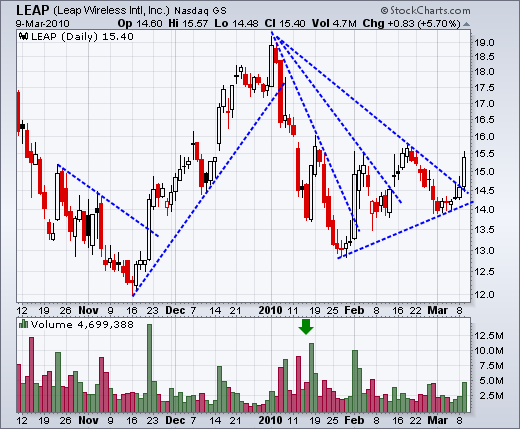
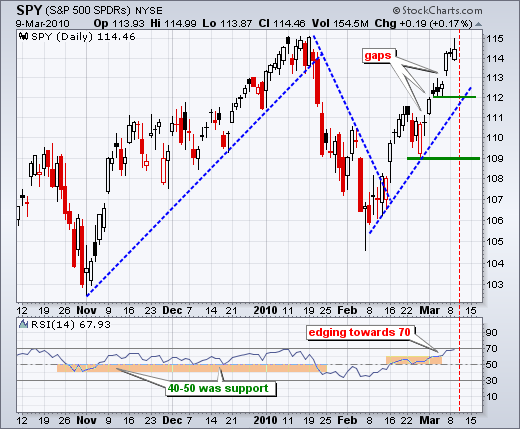
After moving sharply higher in early trading, stocks turned lower in the afternoon and finished mixed on the day. All major indices finished fractionally higher, but the sectors were mixed with three up, five down and one unchanged. With the afternoon selloff, shooting stars formed in the S&P 400 MidCap ETF (MDY) and Dow SPDR (DIA). SPY formed a white candlestick with a modest upper shadow (intraday high). Resistance from the January high is within spitting distance and the 5-week trend is up. The blue dotted lines define the last three swings. I am raising short-term support to 112. Notice that red dotted line shows where support from the upswing line resides today. Support at 112 is confirmed with the three indecisive candlesticks from last week. A move below 112 would fill last week's gap and break this upswing trendline. The 60-minute chart confirms short-term support at 112-113. Charts of interest are after the "continue reading" jump.


About the author:
Arthur Hill, CMT, is the Chief Technical Strategist at TrendInvestorPro.com. Focusing predominantly on US equities and ETFs, his systematic approach of identifying trend, finding signals within the trend, and setting key price levels has made him an esteemed market technician. Arthur has written articles for numerous financial publications including Barrons and Stocks & Commodities Magazine. In addition to his Chartered Market Technician (CMT) designation, he holds an MBA from the Cass Business School at City University in London.
Learn More
