The S&P 500 ETF (SPY) put another notch on its belt today with the 12th straight gain. As far as I can tell, September 1995 was the last such occurrence, after which SPY moved into a seven week trading range. I posted a chart of September 1995 in yesterday's Market Message. The odds certainly point to a correction sooner rather than later. A correction can take the form of a pullback or sideways trading range. As noted yesterday, it could even be a little of both with a falling flag or choppy decline with a slight downward slant. At this point, we are also hostage to the Fed announcement at 2:15 today. While I do not expect a change in policy, the Fed tends to keep traders on the sidelines and we may get clarity after the announcement.
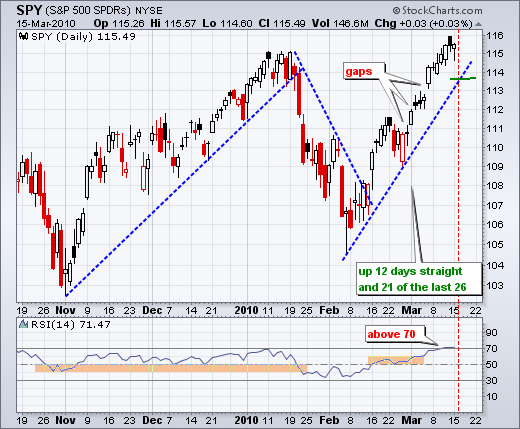

SPY dipped below the channel trendline in early trading, but surged back above 115 with a strong close. Those who missed out are eager to buy the dips. Yesterday's bounce establishes support at 114.5 and a break below this level would be the first sign of weakness. I would let the Fed dust settle first though and ignore breaks before 3PM. With yesterday's dip, RSI broke below 50 and reached its lowest level since late February. Selling pressure is picking up a bit, but not yet enough to forge a short-term reversal.
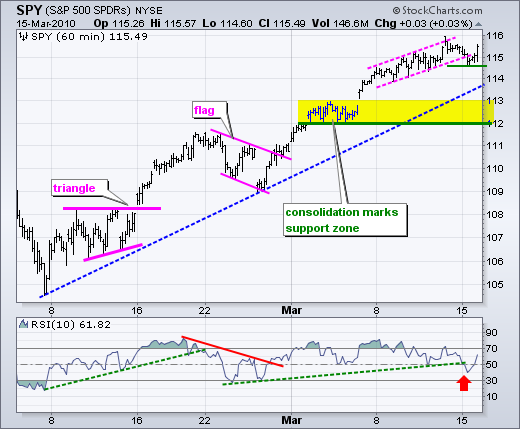
This week's economic docket centers around the Fed's rate decision on Tuesday afternoon (2:15). The market is usually volatile just before and after the announcement. Volatility settles after 3pm as cooler heads prevail and we then get our first clue on post-Fed market direction.
Tuesday Mar 16 - 8:30am - Building Permits
Tuesday Mar 16 - 8:30am - Housing Starts
Tuesday Mar 16 - 2:15pm - FOMC Rate Decision
Wednesday Mar 17 - 8:30am - Core PPI and PPI
Wednesday Mar 17 - 10:30am - Crude Inventories
Thursday Mar 18 - 8:30am - Core CPI and CPI
Thursday Mar 18 - 8:30am - Initial Claims
Friday Mar 18 - 10:00am - Leading Indicators
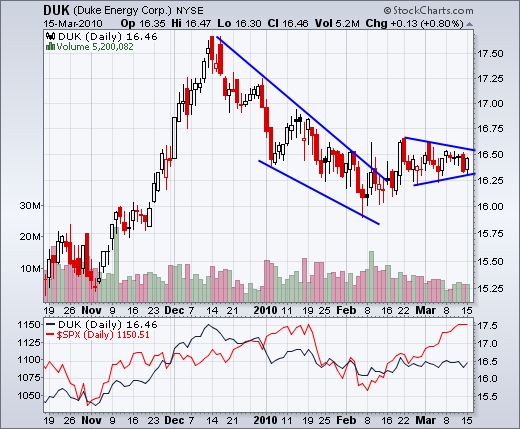
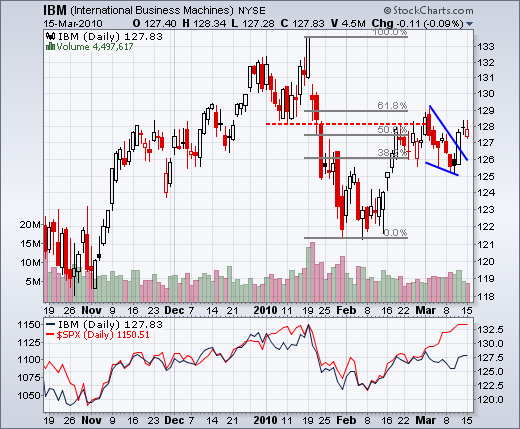
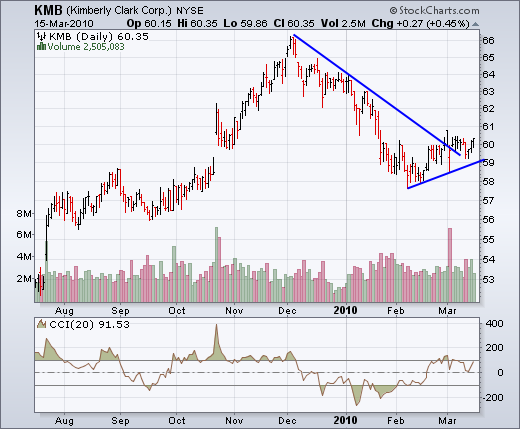
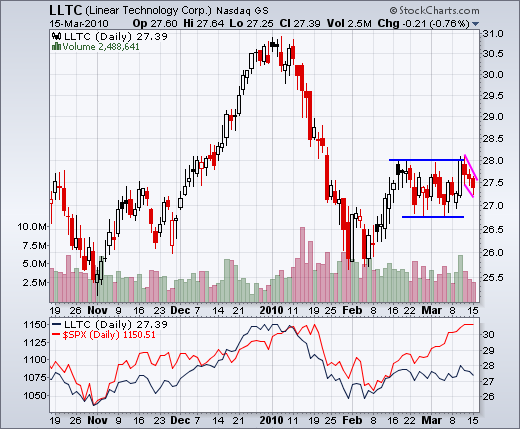
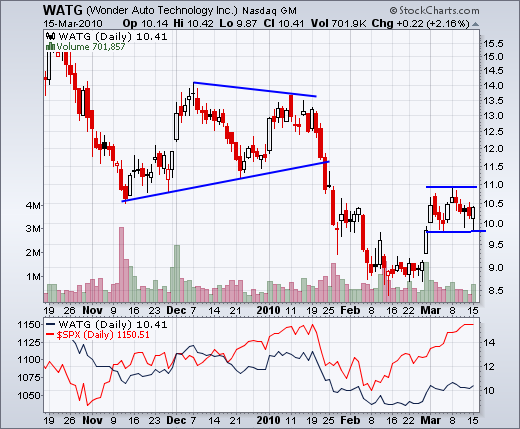
Even though we may see some individual stocks with bearish setups, the overall market remains strong. This means we are more likely to see bullish resolutions than bearish resolutions. There will be a pullback at some point, but bearish resolutions will be the exception until such a pullback materializes. Charts of interest: DUK, IBM, KMB, LLTC, WATG.


About the author:
Arthur Hill, CMT, is the Chief Technical Strategist at TrendInvestorPro.com. Focusing predominantly on US equities and ETFs, his systematic approach of identifying trend, finding signals within the trend, and setting key price levels has made him an esteemed market technician. Arthur has written articles for numerous financial publications including Barrons and Stocks & Commodities Magazine. In addition to his Chartered Market Technician (CMT) designation, he holds an MBA from the Cass Business School at City University in London.
Learn More


