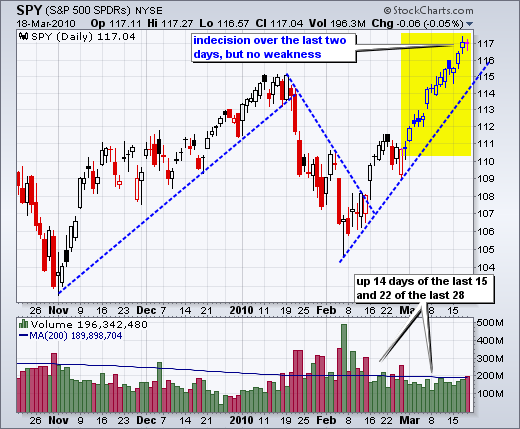
The S&P 500 ETF (SPY) finally broke its string of advances with a small decline on Thursday. And I do mean small. DIA, QQQQ and IWM were up fractionally on the day. The sectors were mixed with five down and four up. Net Advances and Net Advancing Volume for the NYSE and Nasdaq were negative for the second time this week. SPY formed a doji on the daily chart for the second indecisive candlestick in as many days. Indecision is not surprising after such a strong run. The ETF is still overbought and ripe for some sort of pullback. However, everybody and there dog knows this by now. As far as the upswing on the daily chart, the blue dotted trendline extending up from the February low marks support just below 115.


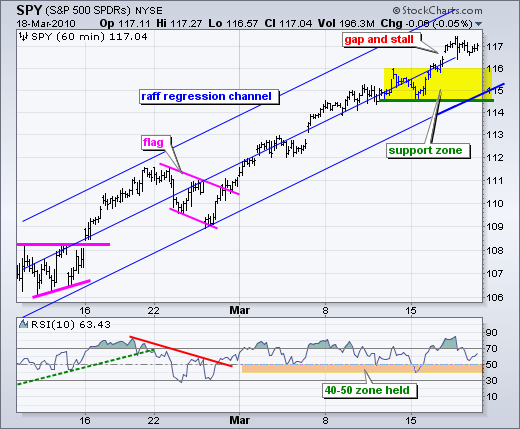
On the 60-minute chart, SPY gapped up and stalled around 117 the last two days. The blue lines show a Raff Regression Channel extending up from mid February. The middle line is a linear regression. The outer lines are parallel to and equidistant from the linear regression. The distance depends on the furthest reaction high or low from the linear regression. In this case, the late February low (flag low) sets the distance. A move below the lower trendline and the support zone would reverse the advance.

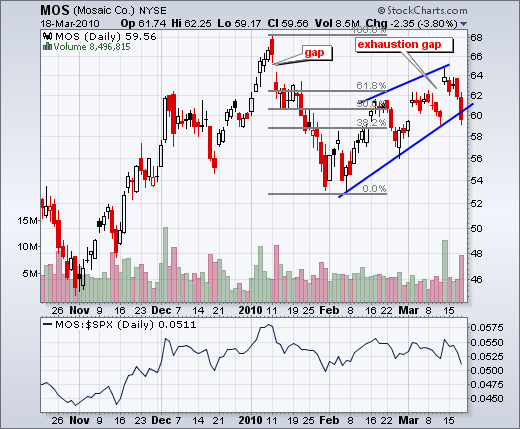
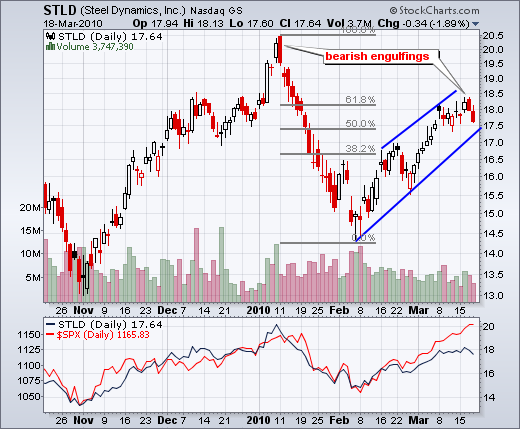
Charts of Interest: MOS, STLD (slim pickings with the market trend up and overbought)

 Charts of interest are just that: charts of interest. We all need to think for ourselves when it comes to trading our own accounts. First, it is the only way to really learn. Second, we are the only ones responsible for our decisions. Think of these charts as food for further analysis. Before making a trade, it is important to have a plan. Plan the trade and trade the plan. Among other things, this includes setting a trigger level, a target area and a stop-loss level. It is also important to plan for three possible price movements: advance, decline or sideways. Have a plan for all three scenarios BEFORE making the trade. Consider possible holding times. And finally, look at overall market conditions and sector/industry performance.

Charts of Interest: MOS, STLD (slim pickings with the market trend up and overbought)

 Charts of interest are just that: charts of interest. We all need to think for ourselves when it comes to trading our own accounts. First, it is the only way to really learn. Second, we are the only ones responsible for our decisions. Think of these charts as food for further analysis. Before making a trade, it is important to have a plan. Plan the trade and trade the plan. Among other things, this includes setting a trigger level, a target area and a stop-loss level. It is also important to plan for three possible price movements: advance, decline or sideways. Have a plan for all three scenarios BEFORE making the trade. Consider possible holding times. And finally, look at overall market conditions and sector/industry performance.

About the author:
Arthur Hill, CMT, is the Chief Technical Strategist at TrendInvestorPro.com. Focusing predominantly on US equities and ETFs, his systematic approach of identifying trend, finding signals within the trend, and setting key price levels has made him an esteemed market technician. Arthur has written articles for numerous financial publications including Barrons and Stocks & Commodities Magazine. In addition to his Chartered Market Technician (CMT) designation, he holds an MBA from the Cass Business School at City University in London.
Learn More


