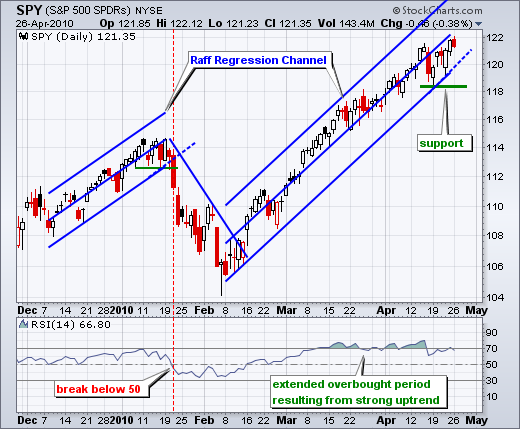
There is overbought and then there is OVERBOUGHT. Overbought conditions after a two week surge show early inning strength, but overbought conditions after a seven week surge show maturity in the late innings (baseball). I also noted in last night's Market Message that the CBOE Put/Call Ratio ($CPC) showed excessive levels of bullishness and the Dow Industrials is currently in the fifth wave of a five wave advance. Even though sentiment, Elliott wave and overbought conditions argue for caution at current levels, we have yet to see any real weakness and certainly no trend reversal. The chart below shows the S&P 500 ETF (SPY) making a new 52-week high last week and trading within a Raff Regression Channel. Lower trendline support is near 120 and key support remains at 118.5.

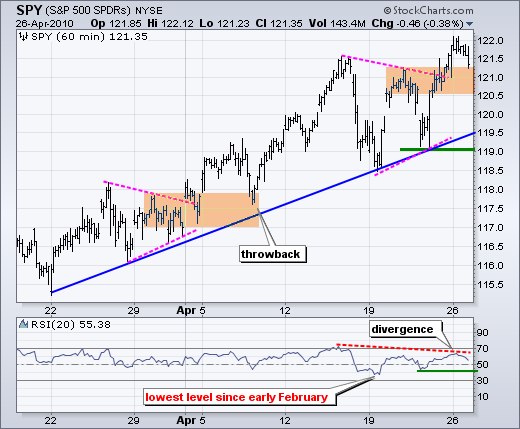
On the 60-minute chart, SPY broke triangle resistance and this breakout is holding so far. The ETF also broke triangle resistance and there was a throwback about a week later. Notice how broken resistance turned into support. The orange area shows the current support zone from broken resistance. A move below 120.5 would question bullish resolve. RSI formed a lower high this week for a negative divergence. I largely ignore negative divergences because they do not work for the most part. However, last week RSI dipped to its lowest level since early February and this shows vulnerability. A move below 40 would confirm the negative divergence and turn momentum bearish.
The Fed starts its two day meeting today with its policy statement expected at 2:15 on Wednesday. Trading often turns quiet heading into the meeting. There is usually a surge in volatility just before and after the announcement. Trading quiets back down around 3PM, which is when we get our first directional clue on the market's reaction to the Fed announcement. I have a feeling that next week's employment report (May 7) could be the one to rock the markets, especially the bond market.
Economic reports:
Tue - Apr 27 - 9:00AM - Case-Shiller Housing Index
Tue - Apr 27 - 10:00AM - Consumer Confidence
Tue - Apr 27 - 10:00AM - FOMC Meeting Begins
Wed - Apr 28 - 10:30AM - Crude Inventories
Wed - Apr 28 - 2:15PM - FOMC Policy Statement
Thu - Apr 29 - 8:30AM - Initial Claims
Fri - Apr 30 - 9:45AM - Chicago PMI
Fri - Apr 30 - 9:55AM - Michigan Sentiment
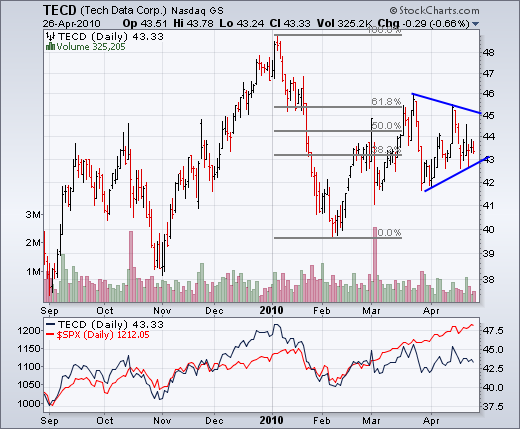
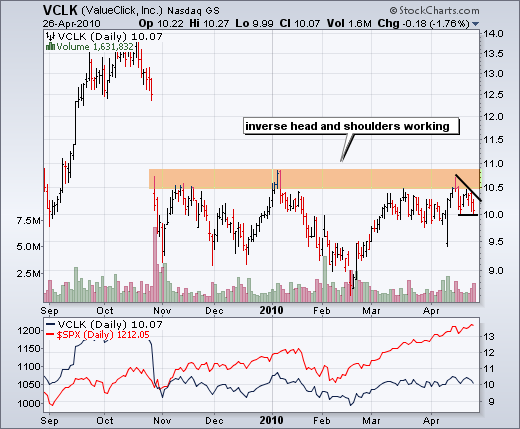
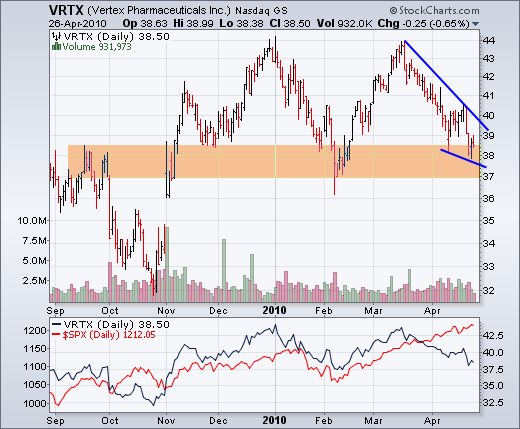
Charts of interest: TECD, VCLK, VRTX
This commentary and charts-of-interest are designed to stimulate thinking. This analysis is not a recommendation to buy, sell, hold or sell short any security (stock ETF or otherwise). We all need to think for ourselves when it comes to trading our own accounts. First, it is the only way to really learn. Second, we are the only ones responsible for our decisions. Think of these charts as food for further analysis. Before making a trade, it is important to have a plan. Plan the trade and trade the plan. Among other things, this includes setting a trigger level, a target area and a stop-loss level. It is also important to plan for three possible price movements: advance, decline or sideways. Have a plan for all three scenarios BEFORE making the trade. Consider possible holding times. And finally, look at overall market conditions and sector/industry performance.

About the author:
Arthur Hill, CMT, is the Chief Technical Strategist at TrendInvestorPro.com. Focusing predominantly on US equities and ETFs, his systematic approach of identifying trend, finding signals within the trend, and setting key price levels has made him an esteemed market technician. Arthur has written articles for numerous financial publications including Barrons and Stocks & Commodities Magazine. In addition to his Chartered Market Technician (CMT) designation, he holds an MBA from the Cass Business School at City University in London.
Learn More


