We made it through the ash cloud and I am back at the office with my normal work setup (computers, big monitors, Nespresso, etc...). Office sweet office!
After a sharp decline on Friday, SPY recovered from early weakness on Monday and extended its gains on Tuesday. Once again, the pullback was short and sharp as the uptrend quickly resumed. I drew two Raff Regression Channels on the daily chart to define the prior upswing and the current upswing. The blue dotted lines show extensions for the lower trendlines. I don't always use the Raff Regression Channel, but it works pretty well during strong-tight trends, such as the uptrend since mid February. The Dec-Jan upswing reversed when SPY broke the lower trendline extension and RSI moved below 50. It would now take a break below the lower channel trendline and Monday's reaction low to reverse this upswing.
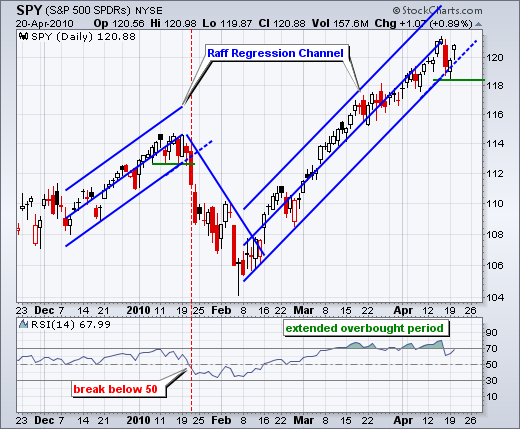
After a sharp decline on Friday, SPY recovered from early weakness on Monday and extended its gains on Tuesday. Once again, the pullback was short and sharp as the uptrend quickly resumed. I drew two Raff Regression Channels on the daily chart to define the prior upswing and the current upswing. The blue dotted lines show extensions for the lower trendlines. I don't always use the Raff Regression Channel, but it works pretty well during strong-tight trends, such as the uptrend since mid February. The Dec-Jan upswing reversed when SPY broke the lower trendline extension and RSI moved below 50. It would now take a break below the lower channel trendline and Monday's reaction low to reverse this upswing.

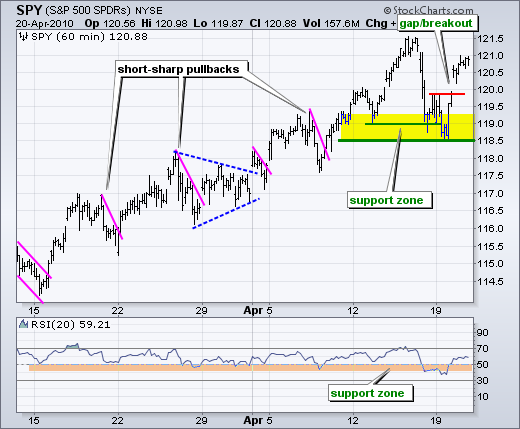
Friday's pullback was sharper than prior pullbacks, but the timeframe (1-2) days was normal and SPY managed to rebound all the same. SPY held the support zone around 119 and broke short-term resistance with a gap on Tuesday morning. The gap and breakout held throughout the day and this area becomes the first support zone to watch for signs of weakness. A move back below 119.8 would suggest second thoughts among the bulls. The surge back above 120 established a clear reaction low at 118.5 and this level becomes key support for the short-term uptrend.
Economic reports:
Wed - Apr 21 - 10:30AM - Crude Inventories
Thu - Apr 22 - 8:30AM - Initial Claims
Thu - Apr 22 - 8:30AM - Continuing Claims
Thu - Apr 22 - 08:30AM - PPI
Thu - Apr 22 - 10:00AM - Existing Home Sales
Fri - Apr 23 - 08:30AM - Durable Orders
Fri - Apr 23 - 10:00AM - New Home Sales
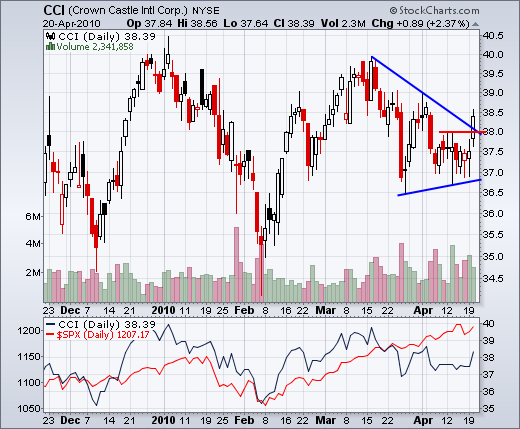
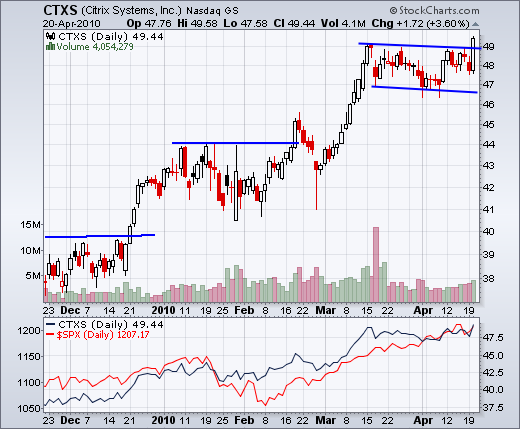
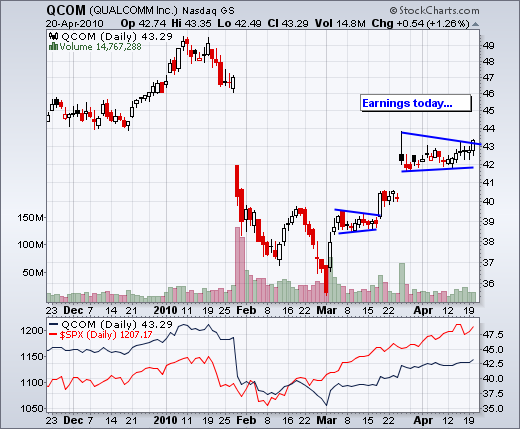
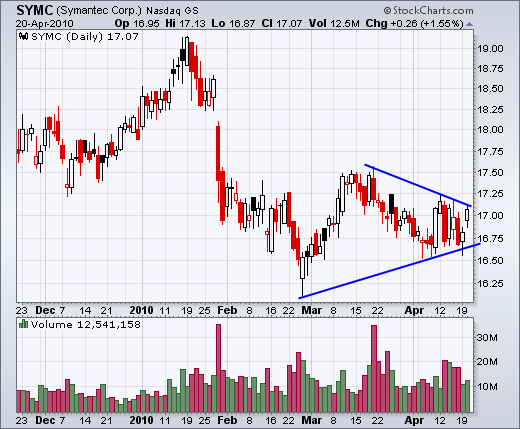
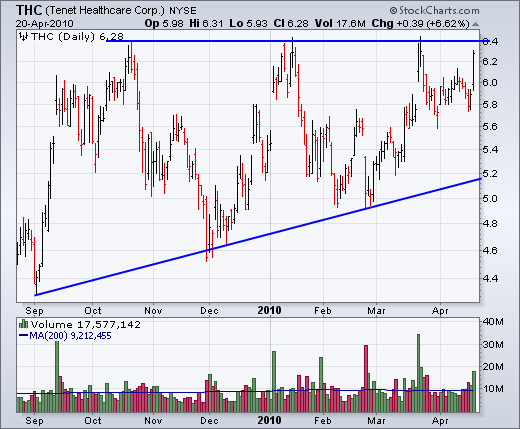
Charts of interest: APA, CCI, CTXS, DISH, FTR, LIFE, QCOM, SYMC, THC
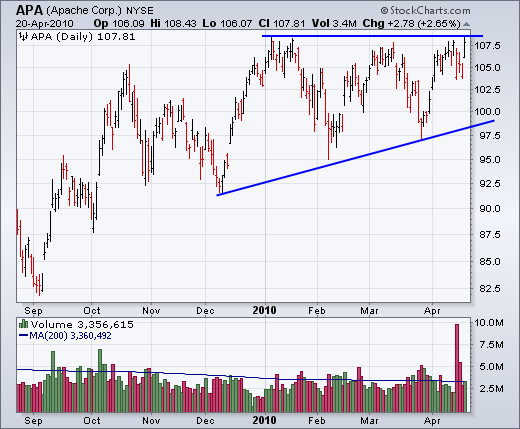
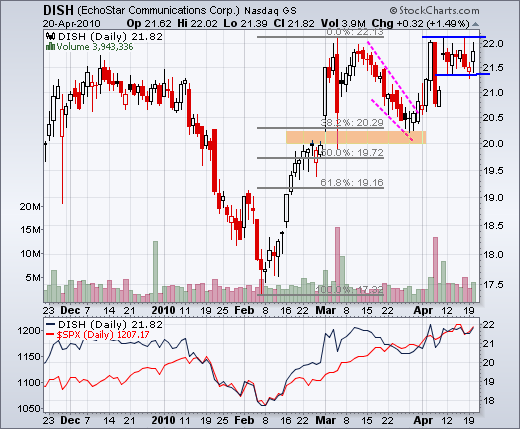
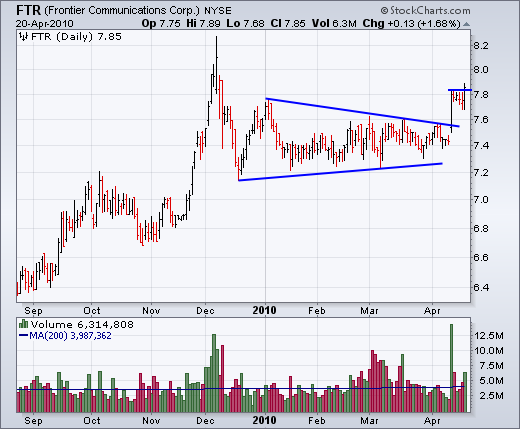
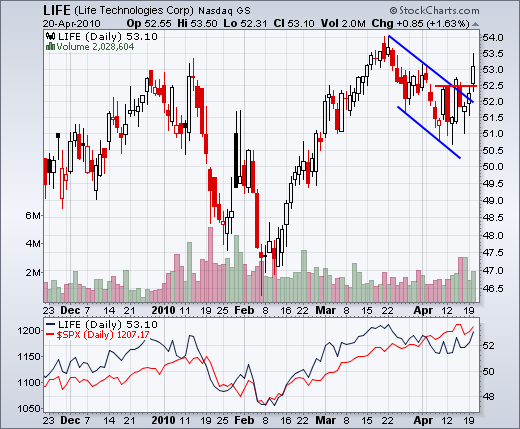
This commentary and charts-of-interest are designed to stimulate thinking. This analysis is not a recommendation to buy, sell, hold or sell short any security (stock ETF or otherwise). We all need to think for ourselves when it comes to trading our own accounts. First, it is the only way to really learn. Second, we are the only ones responsible for our decisions. Think of these charts as food for further analysis. Before making a trade, it is important to have a plan. Plan the trade and trade the plan. Among other things, this includes setting a trigger level, a target area and a stop-loss level. It is also important to plan for three possible price movements: advance, decline or sideways. Have a plan for all three scenarios BEFORE making the trade. Consider possible holding times. And finally, look at overall market conditions and sector/industry performance.

About the author:
Arthur Hill, CMT, is the Chief Technical Strategist at TrendInvestorPro.com. Focusing predominantly on US equities and ETFs, his systematic approach of identifying trend, finding signals within the trend, and setting key price levels has made him an esteemed market technician. Arthur has written articles for numerous financial publications including Barrons and Stocks & Commodities Magazine. In addition to his Chartered Market Technician (CMT) designation, he holds an MBA from the Cass Business School at City University in London.
Learn More
