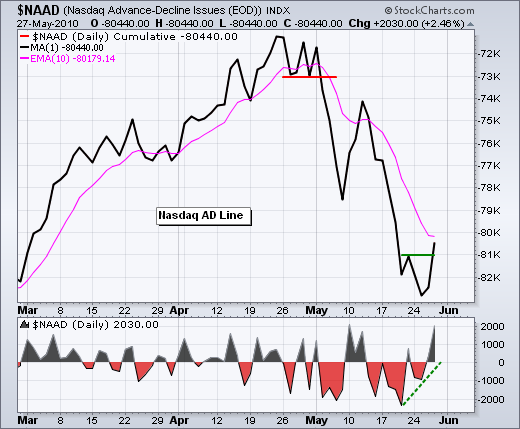
Stocks surged with a broad rally that lifted most boats. Over 90% of NYSE stocks advanced and over 85% of Nasdaq stocks were up on the day. Over 97% of NYSE volume was attributed to advancing issues. Over 90% of Nasdaq volume went into advancers. All major indices were up over 3%. All offensive sectors were up more than 3%. Energy and finance gained over 4%. Exchange volume was below the high levels seen earlier in May, but above the 200-day moving average. All in all, it was a strong follow through that further affirms support from the February lows.

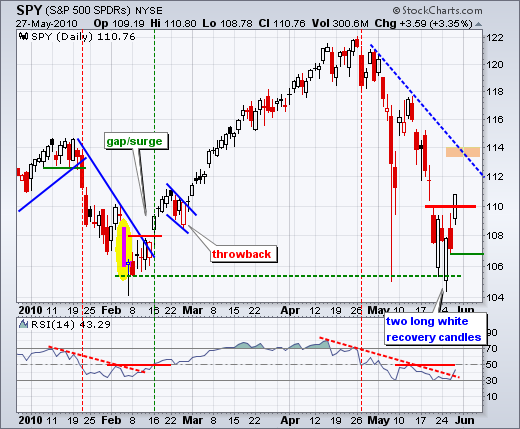
After two long white reversal candlesticks that dipped below 106, Thursday's gap and strong close above 110 should be considered bullish until proven otherwise. A close below 106.8 would argue for a reassessment. For the Medium-term, there is still some work to be done before an "official" trend reversal takes place. First, RSI needs to break above 50. Second, SPY needs to break above the late April trendline (at least).
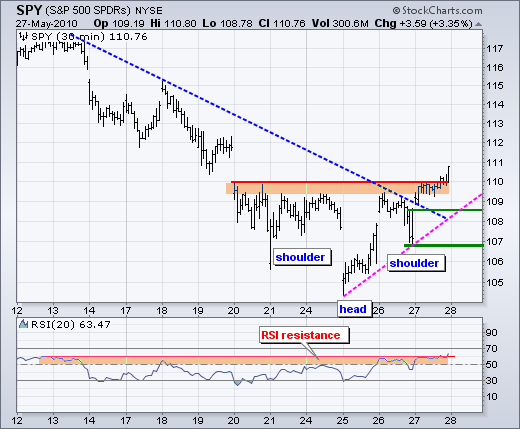
On the 30-minute chart, SPY has an island reversal in the works and an inverse head-and-shoulders pattern. Strictly speaking, an island reversal requires a down gap and an up gap that match (overlap). We have a gap below 106, a small consolidation and a gap above 108. This leaves some price action around 107.5-108 that covers both gaps, but I think the essence of the pattern is there. The head-and-shoulders breakout at 110 is also there. A strong breakout should hold. Nervous nellies can use a move below 108.5 to reassess strength. RSI broke above 60 to turn momentum bullish for the first time since late April.
Key Economic Reports:
Fri - May 28 - 09:45 - Personal Income and Spending
Fri - May 28 - 09:45 - Chicago PMI
Fri - May 28 - 09:55 - U. Michigan Consumer Sentiment
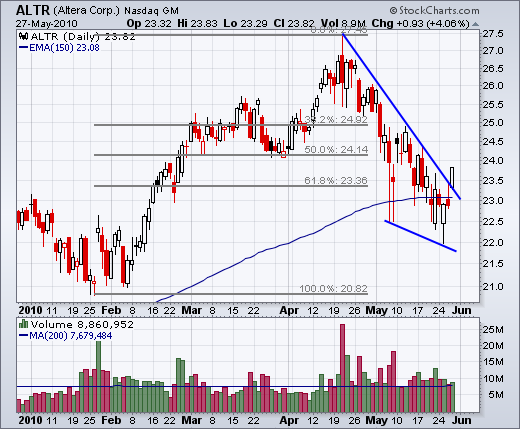
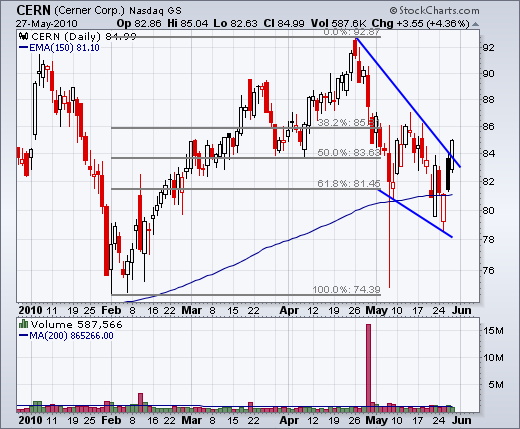
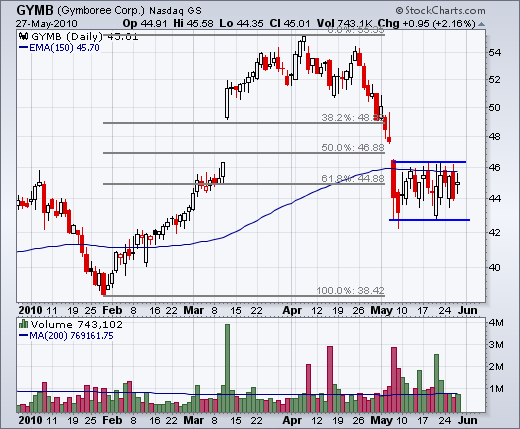
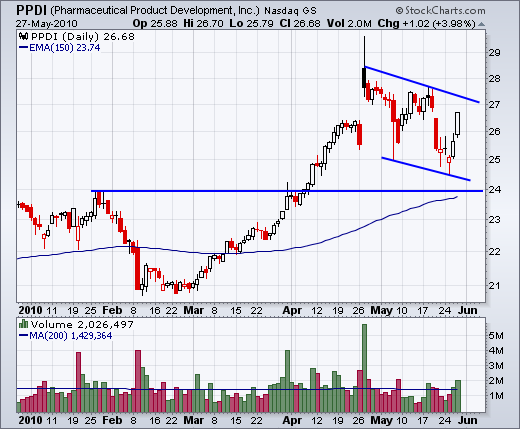
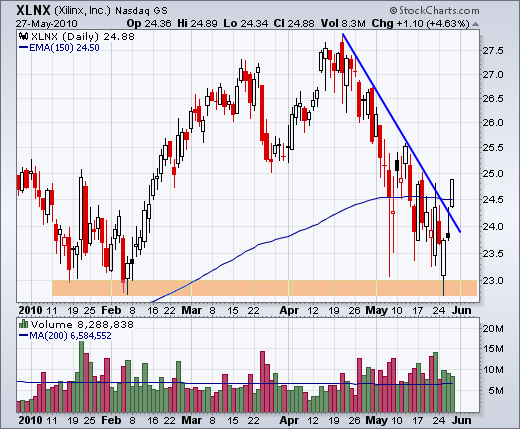
Charts of Interest: ALTR, CERN, GYMB, PPDI, XLNX
This commentary and charts-of-interest are designed to stimulate thinking. This analysis is not a recommendation to buy, sell, hold or sell short any security (stock ETF or otherwise). We all need to think for ourselves when it comes to trading our own accounts. First, it is the only way to really learn. Second, we are the only ones responsible for our decisions. Think of these charts as food for further analysis. Before making a trade, it is important to have a plan. Plan the trade and trade the plan. Among other things, this includes setting a trigger level, a target area and a stop-loss level. It is also important to plan for three possible price movements: advance, decline or sideways. Have a plan for all three scenarios BEFORE making the trade. Consider possible holding times. And finally, look at overall market conditions and sector/industry performance.

On the 30-minute chart, SPY has an island reversal in the works and an inverse head-and-shoulders pattern. Strictly speaking, an island reversal requires a down gap and an up gap that match (overlap). We have a gap below 106, a small consolidation and a gap above 108. This leaves some price action around 107.5-108 that covers both gaps, but I think the essence of the pattern is there. The head-and-shoulders breakout at 110 is also there. A strong breakout should hold. Nervous nellies can use a move below 108.5 to reassess strength. RSI broke above 60 to turn momentum bullish for the first time since late April.

Key Economic Reports:
Fri - May 28 - 09:45 - Personal Income and Spending
Fri - May 28 - 09:45 - Chicago PMI
Fri - May 28 - 09:55 - U. Michigan Consumer Sentiment
Charts of Interest: ALTR, CERN, GYMB, PPDI, XLNX


This commentary and charts-of-interest are designed to stimulate thinking. This analysis is not a recommendation to buy, sell, hold or sell short any security (stock ETF or otherwise). We all need to think for ourselves when it comes to trading our own accounts. First, it is the only way to really learn. Second, we are the only ones responsible for our decisions. Think of these charts as food for further analysis. Before making a trade, it is important to have a plan. Plan the trade and trade the plan. Among other things, this includes setting a trigger level, a target area and a stop-loss level. It is also important to plan for three possible price movements: advance, decline or sideways. Have a plan for all three scenarios BEFORE making the trade. Consider possible holding times. And finally, look at overall market conditions and sector/industry performance.

About the author:
Arthur Hill, CMT, is the Chief Technical Strategist at TrendInvestorPro.com. Focusing predominantly on US equities and ETFs, his systematic approach of identifying trend, finding signals within the trend, and setting key price levels has made him an esteemed market technician. Arthur has written articles for numerous financial publications including Barrons and Stocks & Commodities Magazine. In addition to his Chartered Market Technician (CMT) designation, he holds an MBA from the Cass Business School at City University in London.
Learn More


