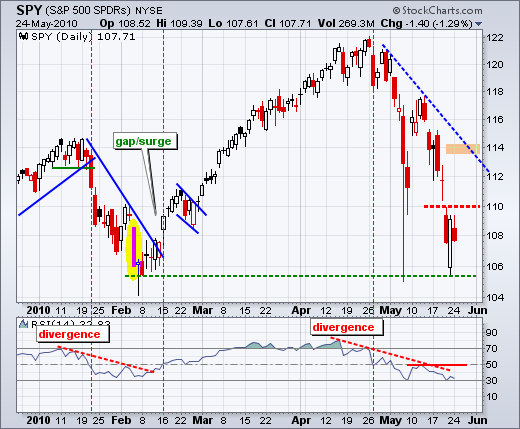
On the daily chart, SPY remains in a 4-5 week downtrend with support from the February lows close at hand. Support in the 106 area is confirmed by the February lows, the May flash-crash low and Friday's piercing line. In addition, SPY was oversold after a 10+ percent decline, fear was rampant as the VIX surged to its March 2009 levels and the put-call ratio showed excessive bearishness. These signs point to a near term low, but the market may need some time to heal and build a base. Once some sort of base evolves, we can then look for a bullish catalyst to signal an actual reversal of the 4-5 week downtrend. This could come after the Memorial Day weekend. I am currently marking short-term resistance at 110, which marks the high of the last three days. A break above this level on good volume and breadth would provide a sign of material strength. RSI is testing oversold levels around 30 again. It would take a break above 50 to turn momentum bullish.

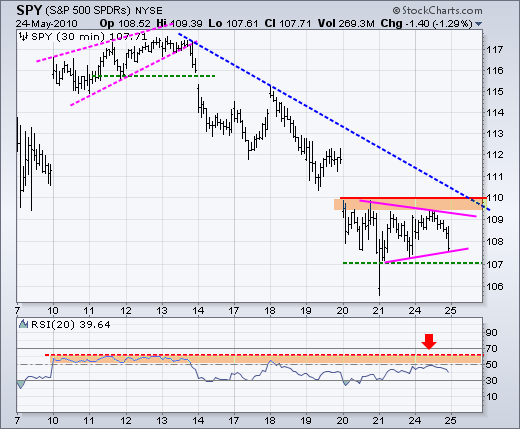
On the 30-minute chart, SPY edged above 109 in the during the day, but gave up these small gains with a sell-off in the late afternoon. Resistance in the 109-110 is confirmed by the trendline extending down from the mid-May highs and the reaction highs of the last three days. A triangle is also taking shape with support at 107. A break below this level would signal a continuation lower. Looking at the futures this morning, SPY is set to open below 106 and it looks like the February lows will be under assault today. RSI remains in bear mode with resistance in the 50-60 zone.
It is hard to say when bad news will actually affect the stock market, but recent news has been nothing short of horrible. First, there is the ongoing European debt crisis. Second, oil continues to spill into the gulf and beyond. Third, there is a crisis on the Korean peninsula. Fourth, congress is working on the biggest financial reform package in decades. Fifth, the Shanghai Composite shows relative weakness with a break below its summer lows. Some may argue that this news is already priced into the market. However, all of these events remain ongoing. The European debt crisis will not be solved anytime soon. BP has proven inept at stopping the spill. There is unlikely to be a diplomatic solution to Korea soon. Financial reform could become the first big issue to be totally resolved in the coming weeks. Wow, congress is working pretty fast.
Key Economic Reports:
Tue - May 25 - 09:00 - Case-Shiller Index
Tue - May 25 - 10:00 - Consumer Confidence
Wed - May 26 - 08:30 - Durable Orders
Wed - May 26 - 10:00 - New Home Sales
Wed - May 26 - 10:30 - Crude Inventories
Thu - May 27 - 08:30 - GDP Estimate
Thu - May 27 - 08:30 - Initial Claims
Fri - May 28 - 09:45 - Personal Income and Spending
Fri - May 28 - 09:45 - Chicago PMI
Fri - May 28 - 09:55 - U. Michigan Consumer Sentiment
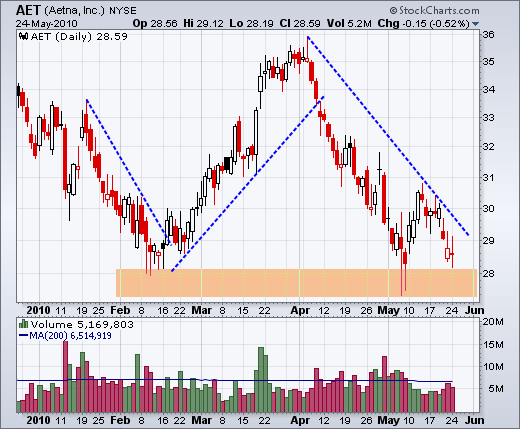
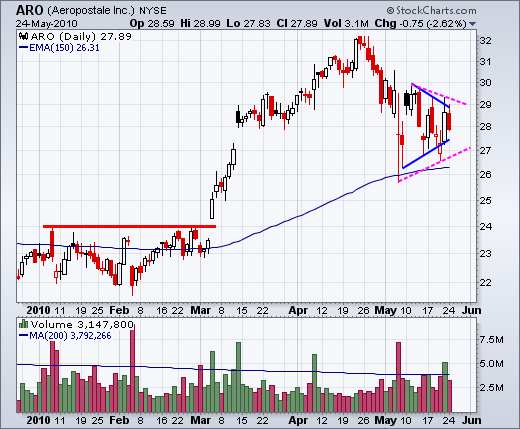
Charts of Interest: AET, ARO, EQR, HUM, NEM, POOL
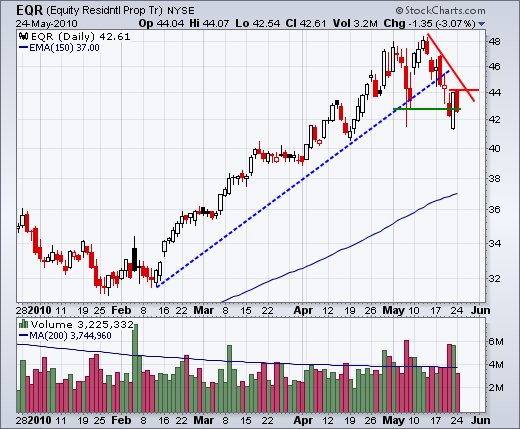
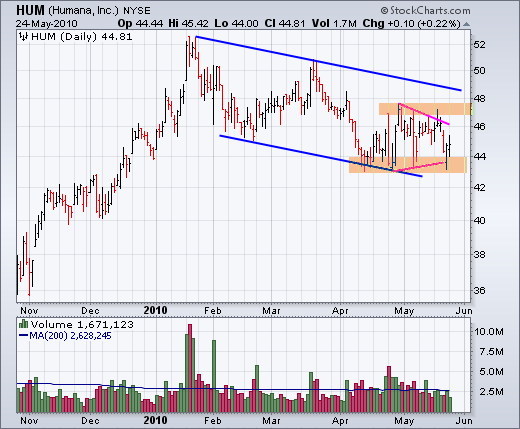
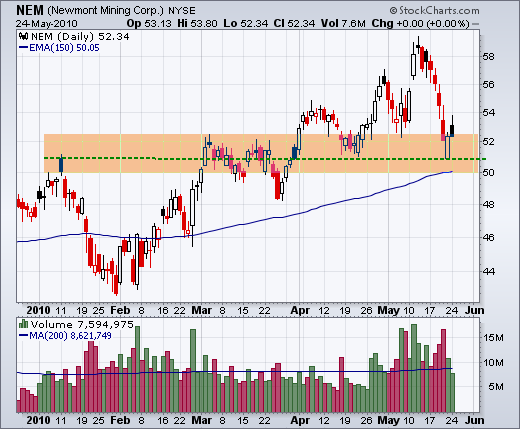
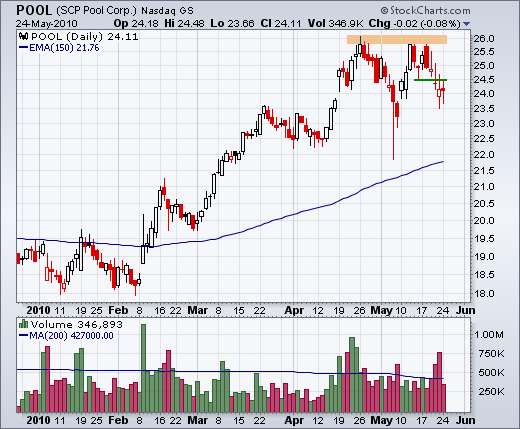
This commentary and charts-of-interest are designed to stimulate thinking. This analysis is not a recommendation to buy, sell, hold or sell short any security (stock ETF or otherwise). We all need to think for ourselves when it comes to trading our own accounts. First, it is the only way to really learn. Second, we are the only ones responsible for our decisions. Think of these charts as food for further analysis. Before making a trade, it is important to have a plan. Plan the trade and trade the plan. Among other things, this includes setting a trigger level, a target area and a stop-loss level. It is also important to plan for three possible price movements: advance, decline or sideways. Have a plan for all three scenarios BEFORE making the trade. Consider possible holding times. And finally, look at overall market conditions and sector/industry performance.

It is hard to say when bad news will actually affect the stock market, but recent news has been nothing short of horrible. First, there is the ongoing European debt crisis. Second, oil continues to spill into the gulf and beyond. Third, there is a crisis on the Korean peninsula. Fourth, congress is working on the biggest financial reform package in decades. Fifth, the Shanghai Composite shows relative weakness with a break below its summer lows. Some may argue that this news is already priced into the market. However, all of these events remain ongoing. The European debt crisis will not be solved anytime soon. BP has proven inept at stopping the spill. There is unlikely to be a diplomatic solution to Korea soon. Financial reform could become the first big issue to be totally resolved in the coming weeks. Wow, congress is working pretty fast.
Key Economic Reports:
Tue - May 25 - 09:00 - Case-Shiller Index
Tue - May 25 - 10:00 - Consumer Confidence
Wed - May 26 - 08:30 - Durable Orders
Wed - May 26 - 10:00 - New Home Sales
Wed - May 26 - 10:30 - Crude Inventories
Thu - May 27 - 08:30 - GDP Estimate
Thu - May 27 - 08:30 - Initial Claims
Fri - May 28 - 09:45 - Personal Income and Spending
Fri - May 28 - 09:45 - Chicago PMI
Fri - May 28 - 09:55 - U. Michigan Consumer Sentiment
Charts of Interest: AET, ARO, EQR, HUM, NEM, POOL


This commentary and charts-of-interest are designed to stimulate thinking. This analysis is not a recommendation to buy, sell, hold or sell short any security (stock ETF or otherwise). We all need to think for ourselves when it comes to trading our own accounts. First, it is the only way to really learn. Second, we are the only ones responsible for our decisions. Think of these charts as food for further analysis. Before making a trade, it is important to have a plan. Plan the trade and trade the plan. Among other things, this includes setting a trigger level, a target area and a stop-loss level. It is also important to plan for three possible price movements: advance, decline or sideways. Have a plan for all three scenarios BEFORE making the trade. Consider possible holding times. And finally, look at overall market conditions and sector/industry performance.

About the author:
Arthur Hill, CMT, is the Chief Technical Strategist at TrendInvestorPro.com. Focusing predominantly on US equities and ETFs, his systematic approach of identifying trend, finding signals within the trend, and setting key price levels has made him an esteemed market technician. Arthur has written articles for numerous financial publications including Barrons and Stocks & Commodities Magazine. In addition to his Chartered Market Technician (CMT) designation, he holds an MBA from the Cass Business School at City University in London.
Learn More


