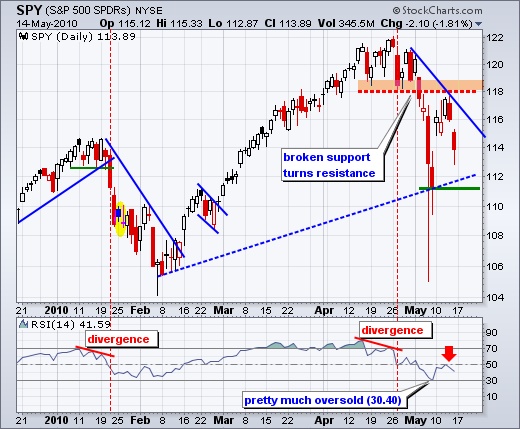
Friday's action is continuing into Monday. As of 4AM ET, the Euro is getting slammed (1.227), gold is higher, US Treasuries are higher and oil is lower. Asian stocks followed Wall Street and Europe with sharp losses on Monday. European indices are down, but the losses are relatively modest in early trading. On the daily chart, SPY met resistance near broken support and declined sharply the last two days. SPY did manage a pop in the final hour to finish off its lows. This was probably short covering ahead of the weekend. SPY has yet to test the 7-May closing low at 111.26. This is the next area to watch on the daily chart. In the indicator window, RSI hit resistance at 50 and turned lower.

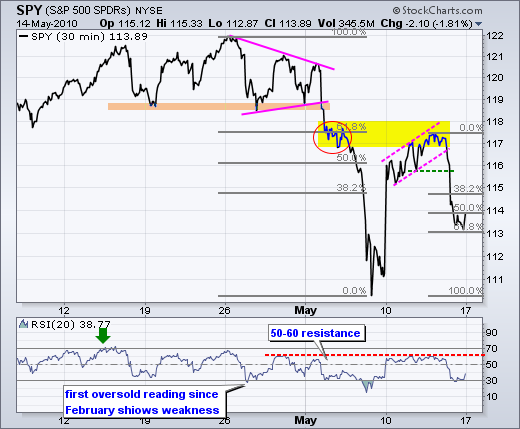
On the 30-minute chart, SPY finished in the first potential support zone around 114 - give or take a point. The decline to 113 marks a 62% retracement of the prior advance. Failure to hold the 113 level could lead to a support test in the 111-112 area. RSI failed in the 50-60 zone and moved below 30 on Friday. Notice that RSI is in short-term bear mode as it ranges between 20 and 60. Look for a break above 60 to signal improving short-term momentum. Overall, SPY seems to be caught between a rock and a hard place. The rock is resistance from the April consolidation (118-122) and support from the spike lows on May 6 and 7. Weakness in Europe is weighing on the world markets to reinforce resistance. New 52-week highs in the US indices just a month ago suggest that the US bull market remains in place and this is just a correction.
Key Economic reports:
Tue - May 18 - 08:30AM - Housing Starts
Tue - May 18 - 08:30AM - Producer Price Index
Wed - May 19 - 08:30AM - Consumer Price Index
Wed - May 19 - 10:30AM - Crude Inventories
Thu - May 20 - 08:30AM - Initial Claims
Thu - May 20 - 10:00AM - Leading Indicators
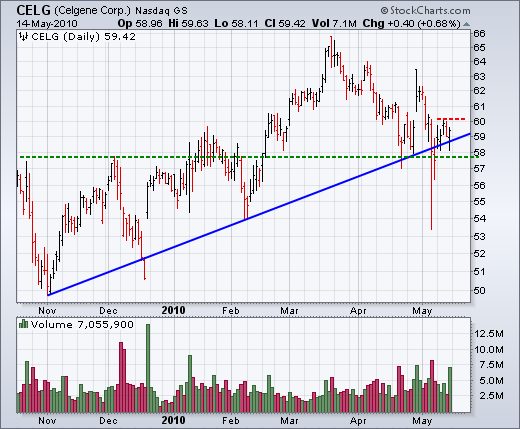
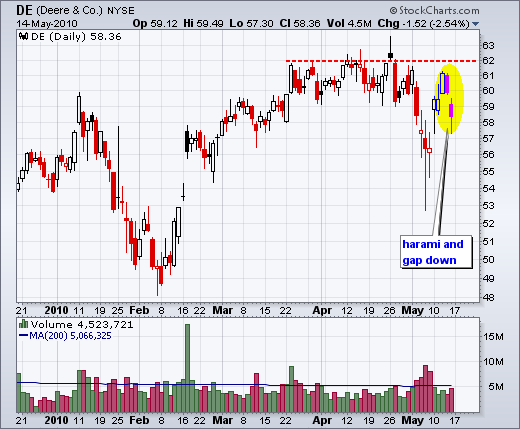
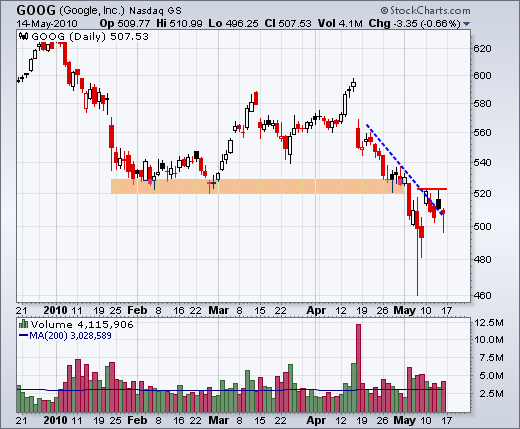
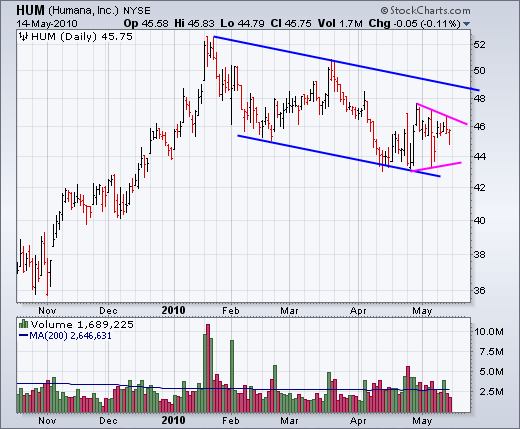
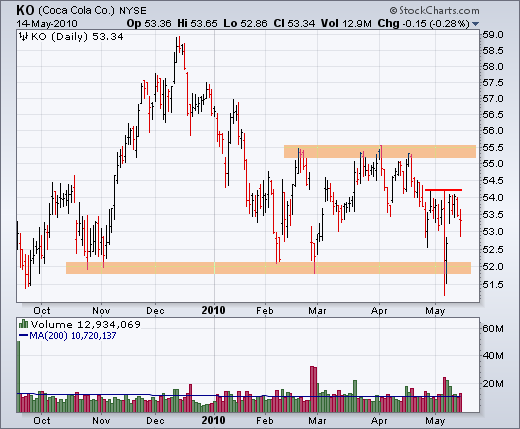
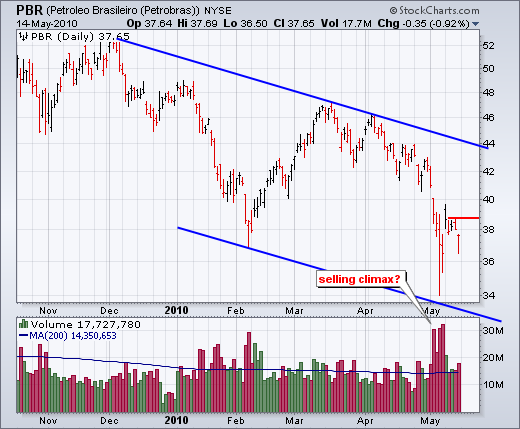
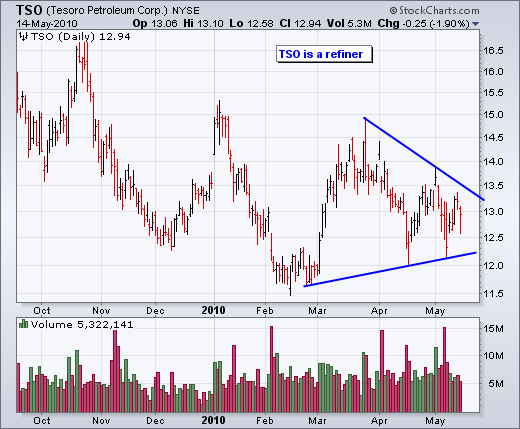
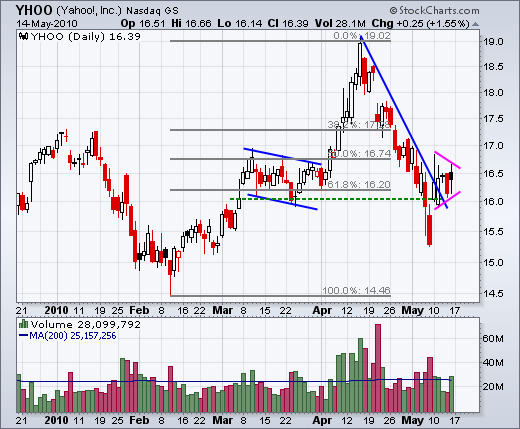
Charts of Interest: CELG, DE, GOOG, HUM, KO, PBR, TSO, YHOO
This commentary and charts-of-interest are designed to stimulate thinking. This analysis is not a recommendation to buy, sell, hold or sell short any security (stock ETF or otherwise). We all need to think for ourselves when it comes to trading our own accounts. First, it is the only way to really learn. Second, we are the only ones responsible for our decisions. Think of these charts as food for further analysis. Before making a trade, it is important to have a plan. Plan the trade and trade the plan. Among other things, this includes setting a trigger level, a target area and a stop-loss level. It is also important to plan for three possible price movements: advance, decline or sideways. Have a plan for all three scenarios BEFORE making the trade. Consider possible holding times. And finally, look at overall market conditions and sector/industry performance.

Key Economic reports:
Tue - May 18 - 08:30AM - Housing Starts
Tue - May 18 - 08:30AM - Producer Price Index
Wed - May 19 - 08:30AM - Consumer Price Index
Wed - May 19 - 10:30AM - Crude Inventories
Thu - May 20 - 08:30AM - Initial Claims
Thu - May 20 - 10:00AM - Leading Indicators
Charts of Interest: CELG, DE, GOOG, HUM, KO, PBR, TSO, YHOO


This commentary and charts-of-interest are designed to stimulate thinking. This analysis is not a recommendation to buy, sell, hold or sell short any security (stock ETF or otherwise). We all need to think for ourselves when it comes to trading our own accounts. First, it is the only way to really learn. Second, we are the only ones responsible for our decisions. Think of these charts as food for further analysis. Before making a trade, it is important to have a plan. Plan the trade and trade the plan. Among other things, this includes setting a trigger level, a target area and a stop-loss level. It is also important to plan for three possible price movements: advance, decline or sideways. Have a plan for all three scenarios BEFORE making the trade. Consider possible holding times. And finally, look at overall market conditions and sector/industry performance.

About the author:
Arthur Hill, CMT, is the Chief Technical Strategist at TrendInvestorPro.com. Focusing predominantly on US equities and ETFs, his systematic approach of identifying trend, finding signals within the trend, and setting key price levels has made him an esteemed market technician. Arthur has written articles for numerous financial publications including Barrons and Stocks & Commodities Magazine. In addition to his Chartered Market Technician (CMT) designation, he holds an MBA from the Cass Business School at City University in London.
Learn More


