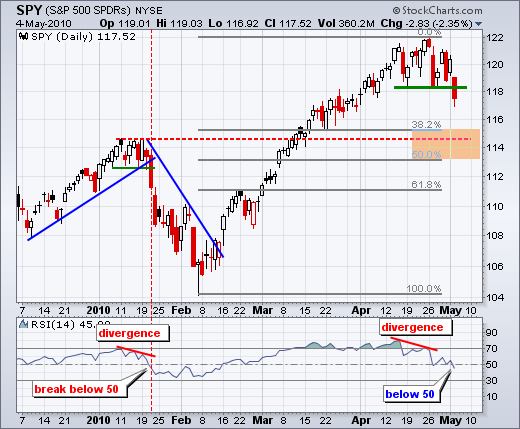
The S&P 500 ETF (SPY) broke range support with a gap down and long red candlestick. Selling pressure was broad based as all nine sectors were down. Healthcare held up the best with a .58% loss. On the daily chart, the next support zone stems from broken resistance and the 38-50% retracement zone. At this point, I would wait for a doji or indecisive candlestick to signal possible support. RSI broke below 50 as momentum took a hit as well. A move back above 119 in SPY and 60 in RSI would call for a re-evaluation. Of note, the February-April uptrend has been reversed, but there is still a bigger uptrend in play from March 2009 to present. Yesterday's support break reversed the 2 1/2 month uptrend.


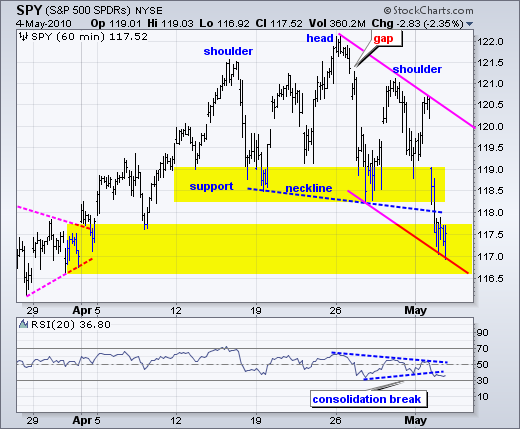
On the 60-minute chart, SPY broke support with a gap down and sharp decline. The decline lasted the first two hours and SPY then consolidated around 117-117.5. Yesterday I noted the head-and-shoulders pattern, diamond and triangle. All three were confirmed with yesterday's support break. Even so, SPY could already be in a support zone. First, the late March triangle marks support in the 116.5-117.5 area. Second, the lower trendline of the falling channel projects support in the 116.5-117 area. This means we could see a consolidation or oversold bounce soon.

Wed - May 05 - 10:00AM - ISM Services
Wed - May 05 - 10:30AM - Crude Inventories
Thu - May 06 - 08:30AM - Initial Claims
Fri - May 07 - 08:30AM - Employment Report
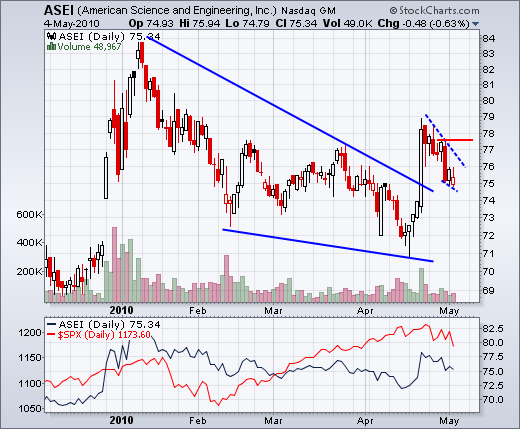
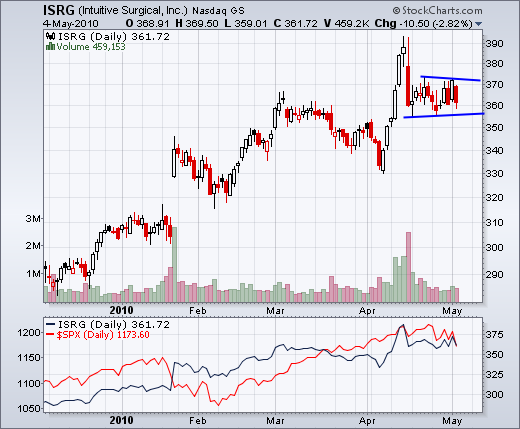
Charts of Interest: ASEI, ISRG


This commentary and charts-of-interest are designed to stimulate thinking. This analysis is not a recommendation to buy, sell, hold or sell short any security (stock ETF or otherwise). We all need to think for ourselves when it comes to trading our own accounts. First, it is the only way to really learn. Second, we are the only ones responsible for our decisions. Think of these charts as food for further analysis. Before making a trade, it is important to have a plan. Plan the trade and trade the plan. Among other things, this includes setting a trigger level, a target area and a stop-loss level. It is also important to plan for three possible price movements: advance, decline or sideways. Have a plan for all three scenarios BEFORE making the trade. Consider possible holding times. And finally, look at overall market conditions and sector/industry performance.

Economic reports:
Wed - May 05 - 8:15AM - ADP EmploymentWed - May 05 - 10:00AM - ISM Services
Wed - May 05 - 10:30AM - Crude Inventories
Thu - May 06 - 08:30AM - Initial Claims
Fri - May 07 - 08:30AM - Employment Report
Charts of Interest: ASEI, ISRG


This commentary and charts-of-interest are designed to stimulate thinking. This analysis is not a recommendation to buy, sell, hold or sell short any security (stock ETF or otherwise). We all need to think for ourselves when it comes to trading our own accounts. First, it is the only way to really learn. Second, we are the only ones responsible for our decisions. Think of these charts as food for further analysis. Before making a trade, it is important to have a plan. Plan the trade and trade the plan. Among other things, this includes setting a trigger level, a target area and a stop-loss level. It is also important to plan for three possible price movements: advance, decline or sideways. Have a plan for all three scenarios BEFORE making the trade. Consider possible holding times. And finally, look at overall market conditions and sector/industry performance.

About the author:
Arthur Hill, CMT, is the Chief Technical Strategist at TrendInvestorPro.com. Focusing predominantly on US equities and ETFs, his systematic approach of identifying trend, finding signals within the trend, and setting key price levels has made him an esteemed market technician. Arthur has written articles for numerous financial publications including Barrons and Stocks & Commodities Magazine. In addition to his Chartered Market Technician (CMT) designation, he holds an MBA from the Cass Business School at City University in London.
Learn More


