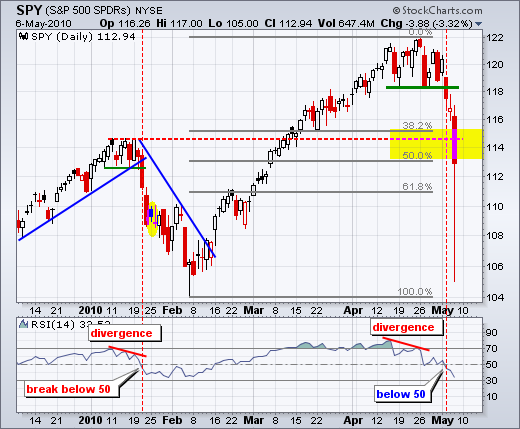
On the daily chart, the S&P 500 ETF (SPY) broke support from the mid April lows and plunged to the 50% retracement mark. I am not sure what to make of the intraday plunge below 106 - except that I would hate to have had a sell order filled at 106. The Nasdaq is reportedly going to cancel "all trades of stocks at prices that were 60 percent above or below the last price at 2:40 p.m. or immediately prior". At this point, I think we need to ignore price action below 112 and focus on the bulk of the move. SPY has now retraced 50% of the February-April decline. While this is normal for a retracement, we may have to allow for some healing time before expecting a reversal near the 50-62% retracement mark. This would involve a consolidation and some indecisive trading. We may have just seen a 4-6 week correction happen in one day


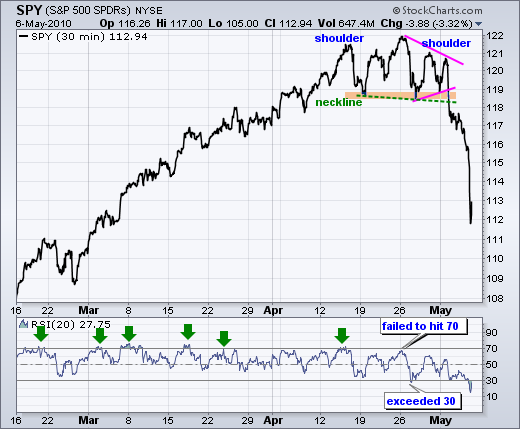
On the 30-minute chart, SPY broke down with a move below 118 on Tuesday. There was a little stalling around 117 and the bottom fell out on Thursday. I mentioned the potential for fireworks on Friday, but it looks like traders made their moves on Thursday. Today, the German parliament votes on the Greek bailout and the Employment report is expected to show non-farm payrolls increasing 187,000. Evidently, some traders decided to move aside (sell or not trade) heading into Friday and this may have created a vacuum. Stocks can fall simply from a lack of demand. The Wall Street Journal reports that a number of high-frequency firms stopped trading during the sharp decline and this may have fueled the fire. In any case, the February-April uptrend reversed with the support break on Tuesday and SPY is now oversold. It is hard to estimate potential resistance levels after yesterday's decline. Best guess is somewhere around the 117 area. RSI is shown moving from overbought in mid April to oversold in late April. This also confirms the trend reversal. Notice how RSI continually became overbought during the entire uptrend and never became oversold. Look for a move back above 70 to turn RSI bullish again.

Economic reports:
Fri - May 07 - 08:00AM - German Vote on Greek bailout
Fri - May 07 - 08:30AM - Employment Report
Charts of Interest: To be continued after the market calms.
This commentary and charts-of-interest are designed to stimulate thinking. This analysis is not a recommendation to buy, sell, hold or sell short any security (stock ETF or otherwise). We all need to think for ourselves when it comes to trading our own accounts. First, it is the only way to really learn. Second, we are the only ones responsible for our decisions. Think of these charts as food for further analysis. Before making a trade, it is important to have a plan. Plan the trade and trade the plan. Among other things, this includes setting a trigger level, a target area and a stop-loss level. It is also important to plan for three possible price movements: advance, decline or sideways. Have a plan for all three scenarios BEFORE making the trade. Consider possible holding times. And finally, look at overall market conditions and sector/industry performance.

About the author:
Arthur Hill, CMT, is the Chief Technical Strategist at TrendInvestorPro.com. Focusing predominantly on US equities and ETFs, his systematic approach of identifying trend, finding signals within the trend, and setting key price levels has made him an esteemed market technician. Arthur has written articles for numerous financial publications including Barrons and Stocks & Commodities Magazine. In addition to his Chartered Market Technician (CMT) designation, he holds an MBA from the Cass Business School at City University in London.
Learn More


