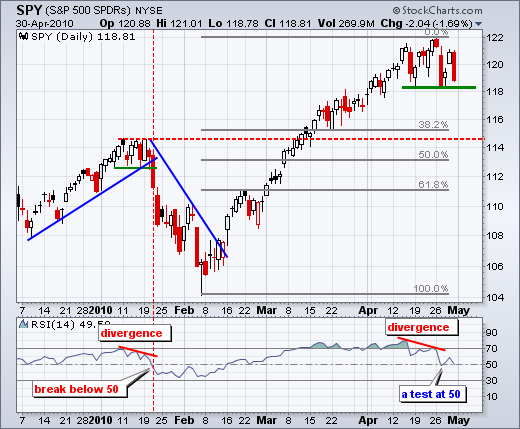
SPY is starting the week with a support test around 118. Also note that the Dow SPDR (DIA) and Nasdaq 100 ETF (QQQQ) are near range support today. There were a few bearish developments last week. First, SPY gapped down on Monday morning and moved sharply lower to form a long red candlestick. Second, this gap held as the ETF failed to hold its surge above 120 on Thursday. Third, SPY failed to hold Thursday's gap up and formed a long red candlestick on Friday. Selling pressure clearly won the week for the first time since early February. So far, support has yet to break and a successful test is not out of the question. We could even see a brief break and then a recovery (bear trap). RSI is also testing momentum support at 50.

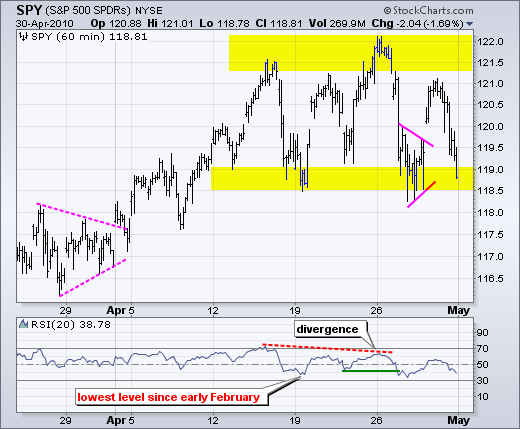
On the 60-minute chart, SPY gapped down early last week and held the gap with a lower high on Thursday. With the decline below 119 on late Friday, the ETF is back in the support zone around 118.5-119. While a break below support would be short-term negative, it may not carry far before the first bounce. There is support around 117.5-118 from the early April low and late March triangle.
The economic docket is rather full this week, especially on Monday and Friday. Reports have been generally positive for the economy and this may help the stock market. Consensus estimates are for non-farm payrolls to expand for the third time in four months. A strong jobs number would be negative for bonds, as would strong economic numbers.
Economic reports:
Mon - May 03 - 8:30AM - Personal Income & Spending
Mon - May 03 - 10:00AM - Construction Spending
Mon - May 03 - 10:00AM - ISM Index
Mon - May 03 - 2:00PM - Auto/Truck Sales
Tue - May 04 - 10:00AM - Factory Orders
Wed - May 05 - 8:15AM - ADP Employment
Wed - May 05 - 10:00AM - ISM Services
Wed - May 05 - 10:30AM - Crude Inventories
Thu - May 06 - 08:30AM - Initial Claims
Fri - May 07 - 08:30AM - Employment Report
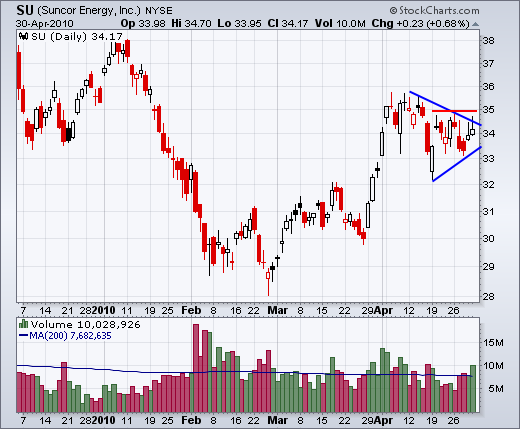
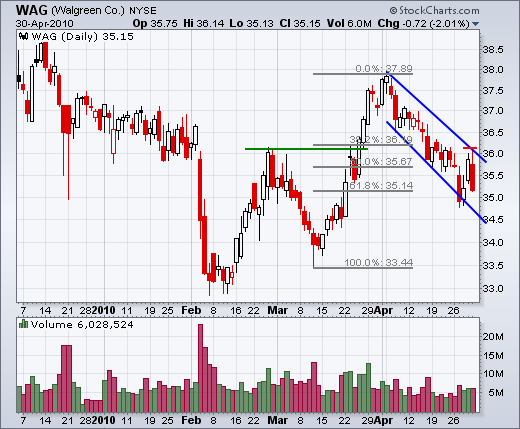
Charts of Interest: GOOG, HD, MHP, NBR, NUE, PBR, SU, WAG
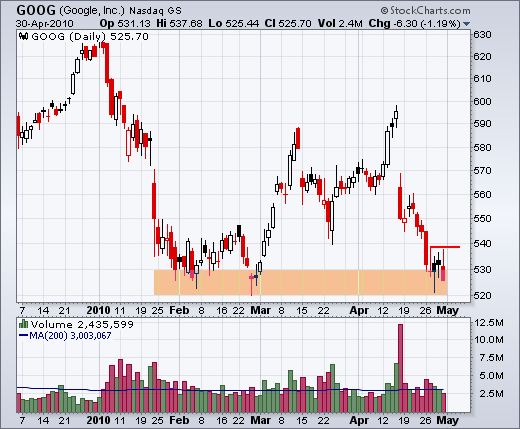
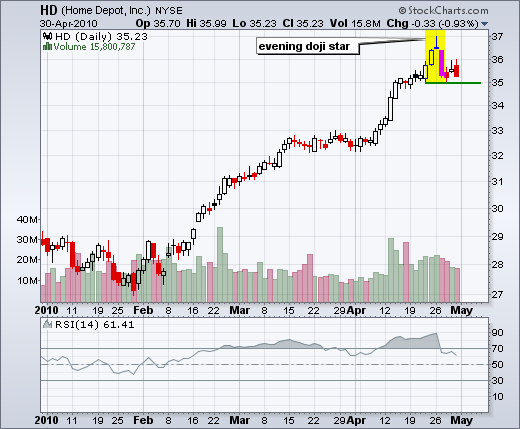
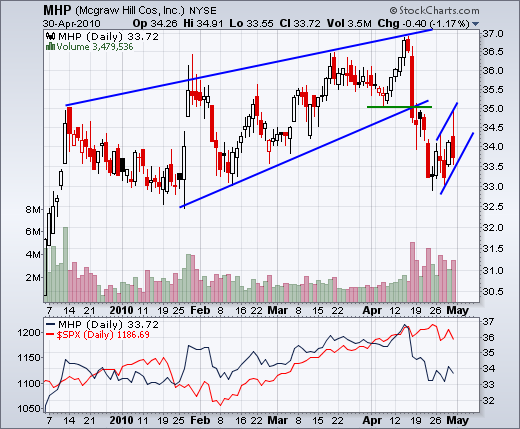
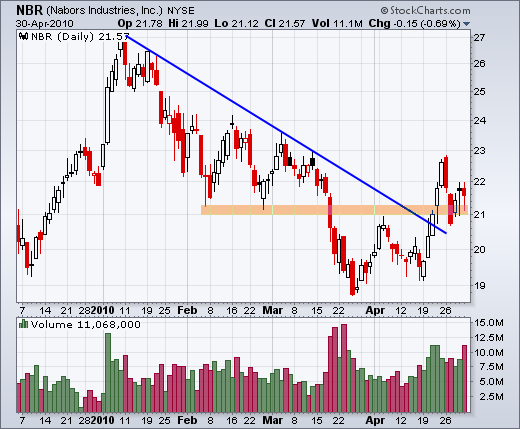
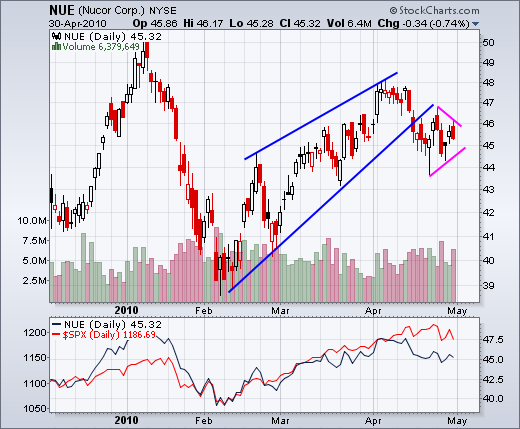
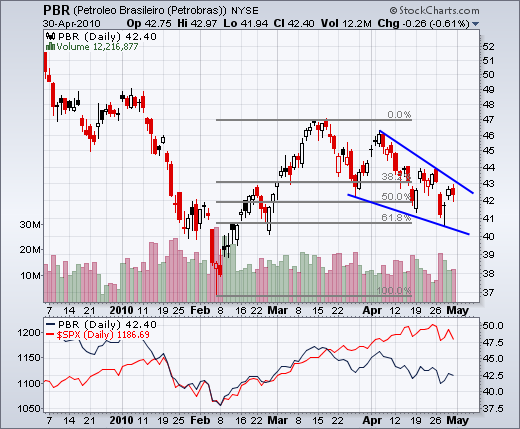
This commentary and charts-of-interest are designed to stimulate thinking. This analysis is not a recommendation to buy, sell, hold or sell short any security (stock ETF or otherwise). We all need to think for ourselves when it comes to trading our own accounts. First, it is the only way to really learn. Second, we are the only ones responsible for our decisions. Think of these charts as food for further analysis. Before making a trade, it is important to have a plan. Plan the trade and trade the plan. Among other things, this includes setting a trigger level, a target area and a stop-loss level. It is also important to plan for three possible price movements: advance, decline or sideways. Have a plan for all three scenarios BEFORE making the trade. Consider possible holding times. And finally, look at overall market conditions and sector/industry performance.

About the author:
Arthur Hill, CMT, is the Chief Technical Strategist at TrendInvestorPro.com. Focusing predominantly on US equities and ETFs, his systematic approach of identifying trend, finding signals within the trend, and setting key price levels has made him an esteemed market technician. Arthur has written articles for numerous financial publications including Barrons and Stocks & Commodities Magazine. In addition to his Chartered Market Technician (CMT) designation, he holds an MBA from the Cass Business School at City University in London.
Learn More


