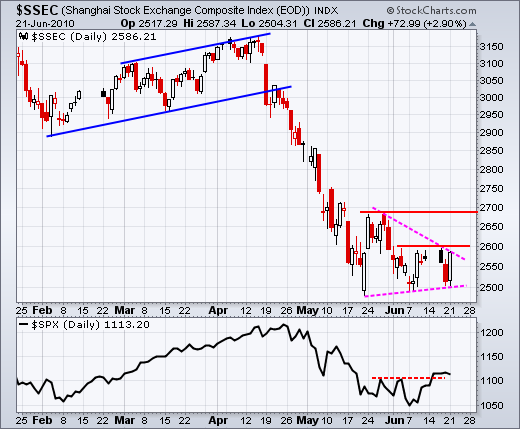
It was a pretty crazy day on Wall Street - and in the rest of the markets. Stocks surged in early trading on news that China would allow the Yuan to strengthen for the first time since July 2005. Obviously, China is not in any hurry to let its currency rise. At this rate, once every 5 years, this could take a long time. The surge in stocks was short-lived as selling pressure took over and remained into the afternoon. The major indices ended the day in negative territory with the Russell 2000 and Nasdaq leading the way lower. Oil gave back its early gains and closed with a small loss. The Euro fell rather sharply to establish resistance in the 124 area. Bonds opened weak and then moved higher as money sought relative safety. Gold, which usually benefits from market turmoil, moved sharply lower on the possibility that a higher Yuan could tame Chinese inflation. China probably made this move to combat inflation, not to appease the US. The move sent the Shanghai Composite ($SSEC) higher on the day, but this key index continues to lag the US and other markets. The chart below shows the Shanghai Composite trading near support from the May-June lows. In contrast to the S&P 500, the index has yet to break its early June high or its late May high. A triangle of sorts is taking shape to mark a consolidation. A break below 2500 would signal a continuation lower, while a break above 2600 would be positive. There are some days missing in mid June due to holidays.

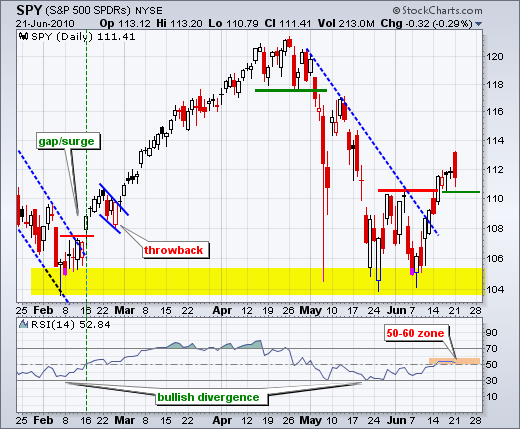
On the daily chart, SPY opened with a gap above 113, but failed to hold gains and closed below 112. Yesterday marked a bearish engulfing or outside reversal day for many ETFs and stocks. While this pattern is negative, yesterday's decline was not enough to negate last week's resistance breakout. First support remains at 110.5, which is based on the hanging man low three days ago. Follow through below this level would be negative. RSI turned flat in the 50-60 zone, which may act as resistance. Momentum favors the bulls as long as RSI remains above 50. Look for a break below 50 to confirm a short-term support break in SPY.
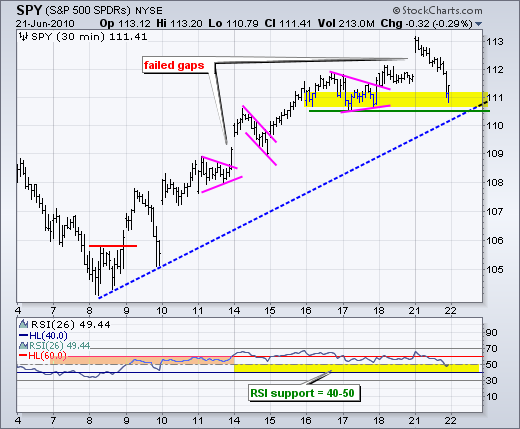
On the 30-minute chart, SPY gapped up on the open and gave back its gains for the second time in two weeks. While failed gaps are negative, it could be just noise. Volume was low yesterday with many participants on the sideline ahead of the FOMC meeting/announcement on Tuesday/Wednesday. The ETF established support around 111 with a few bounces last week and SPY is testing support today. Also notice that RSI is testing support in the 40-50 zone. This is a big test. A break below 110.5 in SPY and 40 in RSI would be short-term bearish. We could see expanding volatility with low volume and the Fed meeting over the next two days.
Key Economic Reports:
Tue - Jun 22 - 09:00 - FOMC Meeting Begins
Tue - Jun 22 - 10:00 - Existing Home Sales
Wed - Jun 23 - 10:00 - New Home Sales May
Wed - Jun 23 - 10:30 - Crude Inventories
Wed - Jun 23 - 14:15 - FOMC Rate Decision
Thu - Jun 24 - 08:30 - Durable Orders May
Thu - Jun 24 - 08:30 - Initial Claims
Fri - Jun 25 - 08:30 - GDP Estimate
Fri - Jun 25 - 09:55 - U Michigan Sentiment
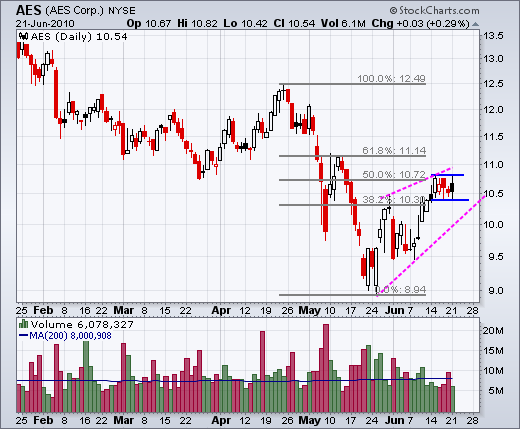
Charts of Interest: AES, AET, DDS, DRI, X
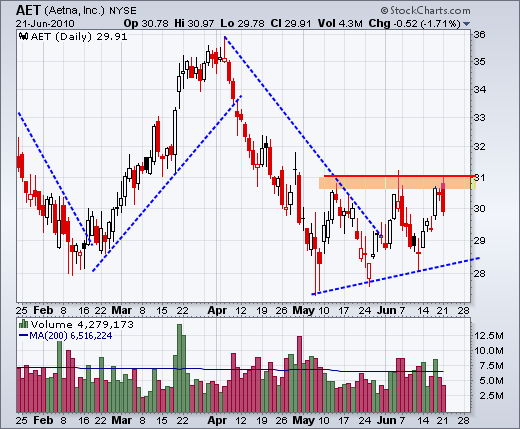
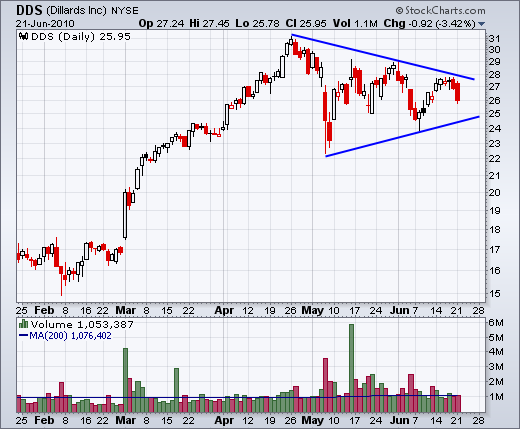
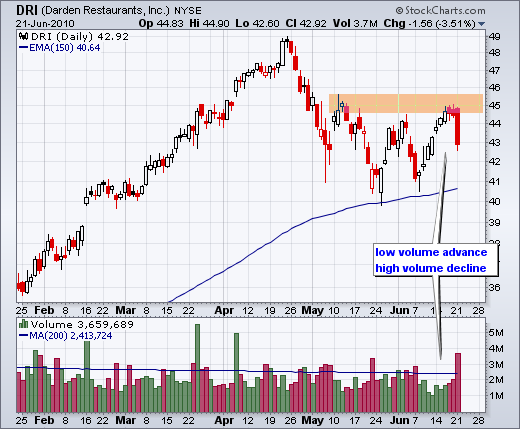
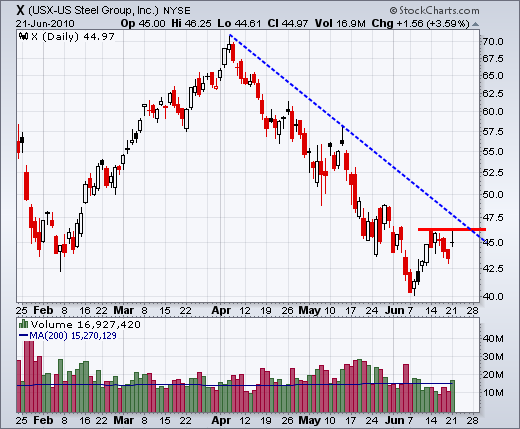
This commentary and charts-of-interest are designed to stimulate thinking. This analysis is not a recommendation to buy, sell, hold or sell short any security (stock ETF or otherwise). We all need to think for ourselves when it comes to trading our own accounts. First, it is the only way to really learn. Second, we are the only ones responsible for our decisions. Think of these charts as food for further analysis. Before making a trade, it is important to have a plan. Plan the trade and trade the plan. Among other things, this includes setting a trigger level, a target area and a stop-loss level. It is also important to plan for three possible price movements: advance, decline or sideways. Have a plan for all three scenarios BEFORE making the trade. Consider possible holding times. And finally, look at overall market conditions and sector/industry performance.

About the author:
Arthur Hill, CMT, is the Chief Technical Strategist at TrendInvestorPro.com. Focusing predominantly on US equities and ETFs, his systematic approach of identifying trend, finding signals within the trend, and setting key price levels has made him an esteemed market technician. Arthur has written articles for numerous financial publications including Barrons and Stocks & Commodities Magazine. In addition to his Chartered Market Technician (CMT) designation, he holds an MBA from the Cass Business School at City University in London.
Learn More


