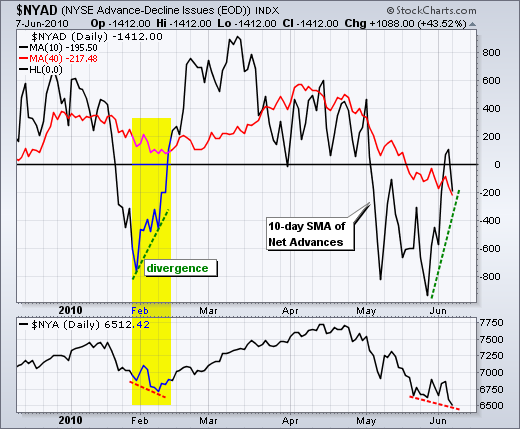
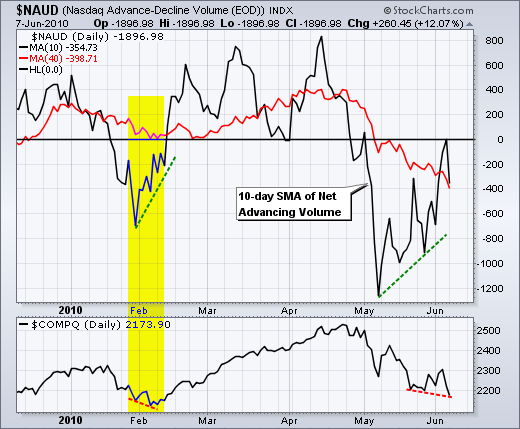
It was another day of heavy selling pressure, but not as heavy as Friday. The AD Lines and AD Volume Lines for the Nasdaq and NYSE all moved to new lows for the move. Even with these new lows, selling pressure is less than it was in May. The first chart shows the 10-day SMA for NYSE Net Advances (advances less declines) in black and the 50-day SMA in red. The 10-day recorded lower lows in May, but surged into positive territory last week. With the sharp decline over the last two days, the indicator moved back into negative territory. However, a bullish divergence similar to February is working. Notice how the NY Composite moved to a new low in early February, but the indicator formed a higher low and then moved into positive territory. Another move into positive territory would turn this indicator bullish and could foreshadow a reversal of the 6 week downtrend in the stock market. The next chart shows the same indicators for Nasdaq Net Advancing Volume. Notice that the 10-day SMA for Net Advancing Volume bottomed in early May and has a larger bullish divergence working.

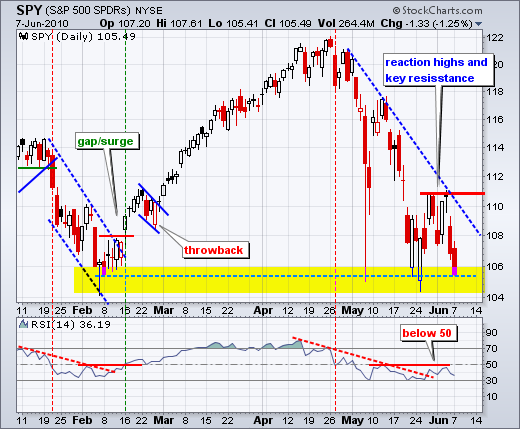
On the daily chart, the S&P 500 ETF (SPY) closed at its lowest level since February 8th. Yes, Monday's close was 3 cents above the 8-Feb close. With the February and May lows within spitting distance, we are back in bottom picking territory. The overall trend since late April remains down, but the ETF is oversold and near support. SPY is oversold because it is down around 5% in two days. Also notice that RSI has a small bullish divergence working. SPY closed below its May closing lows and RSI remains above its late May low. A break above 50 would confirm this bullish divergence and turn momentum bullish. SPY needs to break above key resistance from the late May and early June highs to fully reverse the downtrend. Those not up for picking bottoms or catching falling knives, may wait for a decisive breakout and then a throwback like the small falling flag in late February.
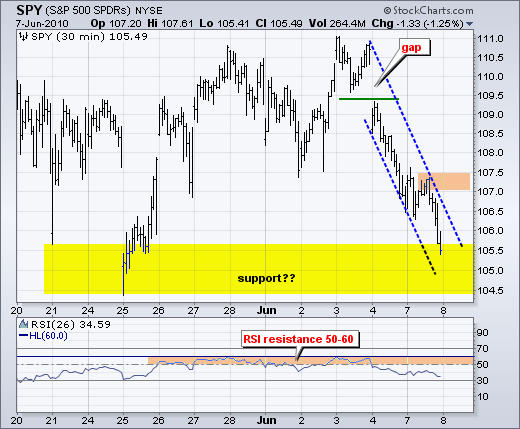
On the 30-minute chart, SPY managed to stall around 106.5-107.5 in early trading on Monday, but selling pressure hit in the afternoon and drove stocks to their lows for the day. Eager sellers and nervous buyers make for soft support levels. With the afternoon high, SPY established its first resistance zone around 107-107.5. A break above this level would reverse the two day slide. RSI remains in short-term bear mode and a break above 60 is needed to turn this momentum indicator bullish again.
Key Economic Reports:
Wed - Jun 09 - 10:30 - Oil Inventories
Wed - Jun 09 - 14:00 - Fed Beige Book
Thu - Jun 10 - 08:30 - Initial Claims
Fri - Jun 11 - 08:30 - Retail Sales
Fri - Jun 11 - 09:55 - Michigan Sentiment
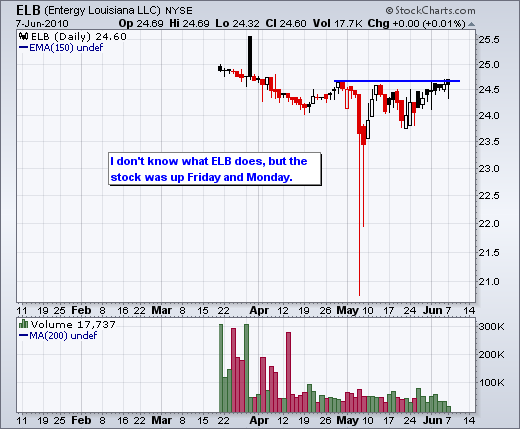
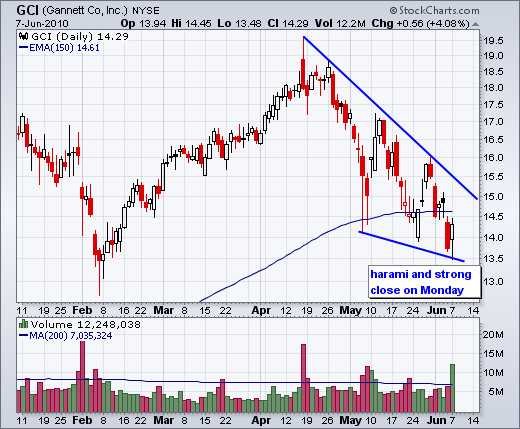
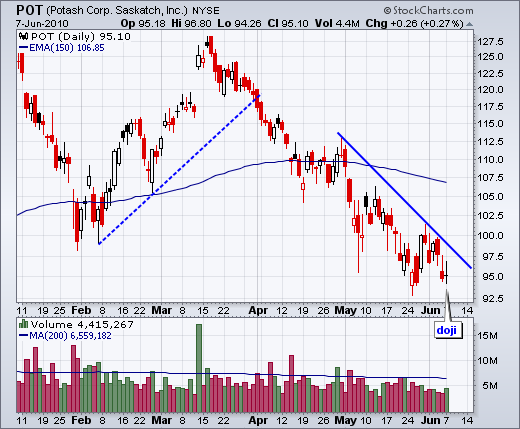
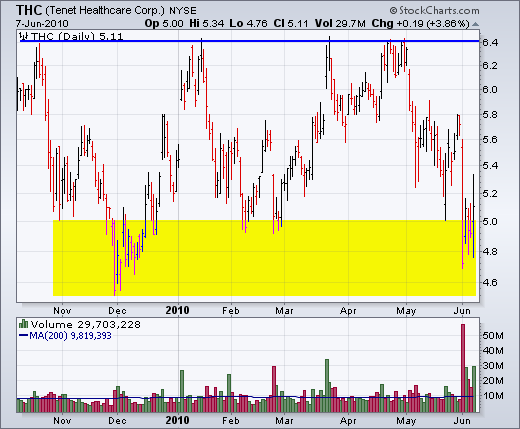
Charts of Interest: ELB, GCI, POT, THC
This commentary and charts-of-interest are designed to stimulate thinking. This analysis is not a recommendation to buy, sell, hold or sell short any security (stock ETF or otherwise). We all need to think for ourselves when it comes to trading our own accounts. First, it is the only way to really learn. Second, we are the only ones responsible for our decisions. Think of these charts as food for further analysis. Before making a trade, it is important to have a plan. Plan the trade and trade the plan. Among other things, this includes setting a trigger level, a target area and a stop-loss level. It is also important to plan for three possible price movements: advance, decline or sideways. Have a plan for all three scenarios BEFORE making the trade. Consider possible holding times. And finally, look at overall market conditions and sector/industry performance.

About the author:
Arthur Hill, CMT, is the Chief Technical Strategist at TrendInvestorPro.com. Focusing predominantly on US equities and ETFs, his systematic approach of identifying trend, finding signals within the trend, and setting key price levels has made him an esteemed market technician. Arthur has written articles for numerous financial publications including Barrons and Stocks & Commodities Magazine. In addition to his Chartered Market Technician (CMT) designation, he holds an MBA from the Cass Business School at City University in London.
Learn More


