At this point the medium-term trends (daily charts) are clearly in bear mode (downtrends). However, the major index ETFs are short-term oversold after sharp declines. In addition, many are trading near potential support from their May lows. "Potential" is the key word here. Support levels are potential in a downtrend and not expected to hold. Resistance levels really hold the key and they are expected to hold. In any case, being oversold and at support is a recipe for a bounce or consolidation.
On the daily chart, SPY came crashing down to the May-June lows with a sharp decline the last seven days. The ETF is down around 8% from the gap open on Monday, June 21st. This failure is when it all started. As noted above, the ETF is short-term oversold and at potential support from the February-May-June lows. This area also marks neckline support of a head-and-shoulders pattern that the whole world seems to see. More about that pattern in the Market Message later today.
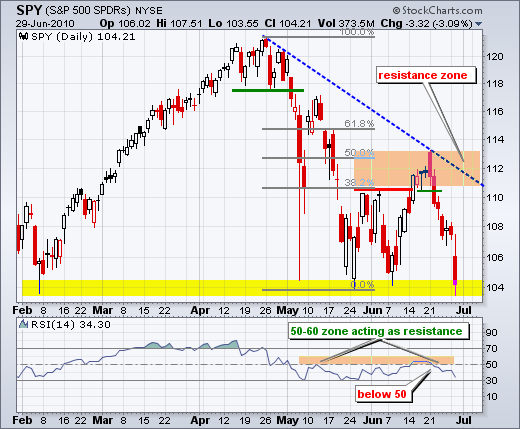
On the daily chart, SPY came crashing down to the May-June lows with a sharp decline the last seven days. The ETF is down around 8% from the gap open on Monday, June 21st. This failure is when it all started. As noted above, the ETF is short-term oversold and at potential support from the February-May-June lows. This area also marks neckline support of a head-and-shoulders pattern that the whole world seems to see. More about that pattern in the Market Message later today.

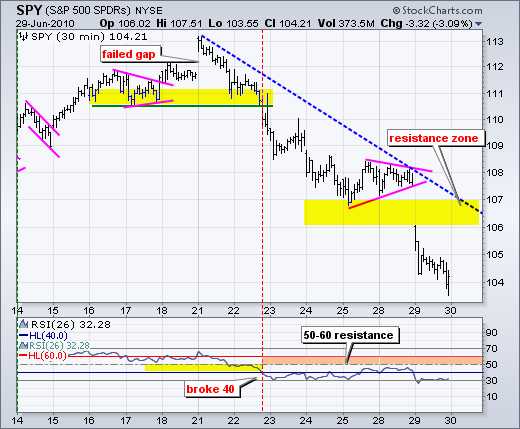
On the 30-minute chart, SPY gapped down through triangle support and then continued lower to close near the low for the day. The gap zone and trendline extending down from the 21-June high mark a resistance zone around 106-107. Actually, I would be surprised to see an oversold bounce make it this high before the employment report. A better-than-expected employment report could produce such a lift. On the other hand, another worse-than-expected number could send the market down sharply again.
It is a busy week on the economic calendar with the employment report due on Friday. The last report (June 4th) sent stocks sharply lower after non-farm payrolls grew less than expected. This report could have an amplified impact because trading may be thin on Friday. Monday, July 5th, is an exchange holiday and traders may look to get a jump on the weekend with an early exit on Friday. Hey, I am thinking that way myself!
Key Economic Reports:
Jun 30 - 08:15 - ADP Employment Report
Jun 30 - 09:45 - Chicago PMI
Jun 30 - 10:30 - Crude Inventories
Jul 01 - 08:30 - Initial Claims
Jul 01 - 10:00 - ISM Index
Jul 01 - 10:00 - Pending Home Sales
Jul 01 - 14:00 - Auto-Truck Sales
Jul 02 - 08:30 - Unemployment Report
Jul 02 - 10:00 - Factory Orders
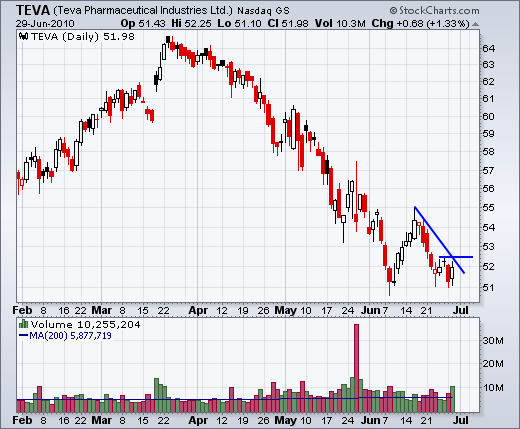
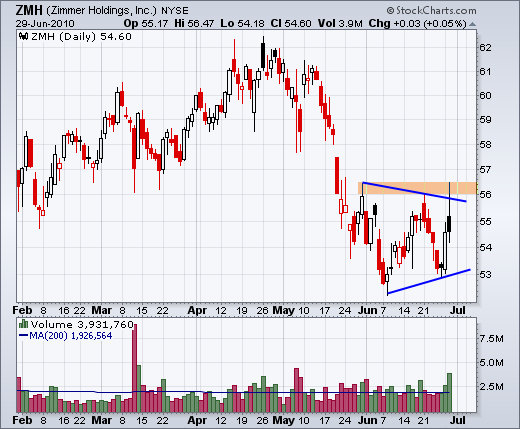
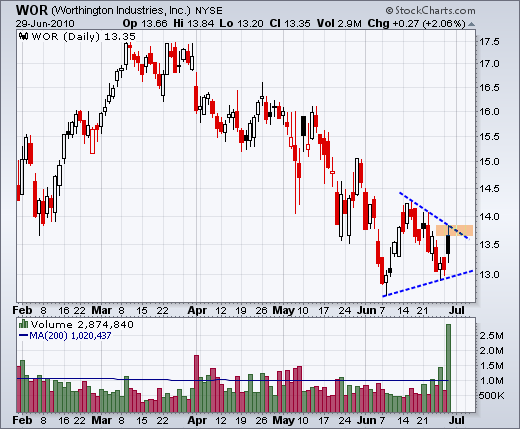
Charts of Interest: TEVA, ZMH, WOR
This commentary and charts-of-interest are designed to stimulate thinking. This analysis is not a recommendation to buy, sell, hold or sell short any security (stock ETF or otherwise). We all need to think for ourselves when it comes to trading our own accounts. First, it is the only way to really learn. Second, we are the only ones responsible for our decisions. Think of these charts as food for further analysis. Before making a trade, it is important to have a plan. Plan the trade and trade the plan. Among other things, this includes setting a trigger level, a target area and a stop-loss level. It is also important to plan for three possible price movements: advance, decline or sideways. Have a plan for all three scenarios BEFORE making the trade. Consider possible holding times. And finally, look at overall market conditions and sector/industry performance.

It is a busy week on the economic calendar with the employment report due on Friday. The last report (June 4th) sent stocks sharply lower after non-farm payrolls grew less than expected. This report could have an amplified impact because trading may be thin on Friday. Monday, July 5th, is an exchange holiday and traders may look to get a jump on the weekend with an early exit on Friday. Hey, I am thinking that way myself!
Key Economic Reports:
Jun 30 - 08:15 - ADP Employment Report
Jun 30 - 09:45 - Chicago PMI
Jun 30 - 10:30 - Crude Inventories
Jul 01 - 08:30 - Initial Claims
Jul 01 - 10:00 - ISM Index
Jul 01 - 10:00 - Pending Home Sales
Jul 01 - 14:00 - Auto-Truck Sales
Jul 02 - 08:30 - Unemployment Report
Jul 02 - 10:00 - Factory Orders
Charts of Interest: TEVA, ZMH, WOR


This commentary and charts-of-interest are designed to stimulate thinking. This analysis is not a recommendation to buy, sell, hold or sell short any security (stock ETF or otherwise). We all need to think for ourselves when it comes to trading our own accounts. First, it is the only way to really learn. Second, we are the only ones responsible for our decisions. Think of these charts as food for further analysis. Before making a trade, it is important to have a plan. Plan the trade and trade the plan. Among other things, this includes setting a trigger level, a target area and a stop-loss level. It is also important to plan for three possible price movements: advance, decline or sideways. Have a plan for all three scenarios BEFORE making the trade. Consider possible holding times. And finally, look at overall market conditions and sector/industry performance.

About the author:
Arthur Hill, CMT, is the Chief Technical Strategist at TrendInvestorPro.com. Focusing predominantly on US equities and ETFs, his systematic approach of identifying trend, finding signals within the trend, and setting key price levels has made him an esteemed market technician. Arthur has written articles for numerous financial publications including Barrons and Stocks & Commodities Magazine. In addition to his Chartered Market Technician (CMT) designation, he holds an MBA from the Cass Business School at City University in London.
Learn More


